Systema Monitor (Week 44)
Week ending 30 October: Risk Off lasted one week. Every index rose about 2%, foreign investors turned net buyers, and momentum is Healthy again.
Market data in this review is as of 30 October 2026.
 Watch the video: Systema Monitor (Week 44)
This is market commentary for information only. It’s not investment advice.
Hello, and welcome to Systema Monitor for the week ending the thirtieth of October.
Market Regime
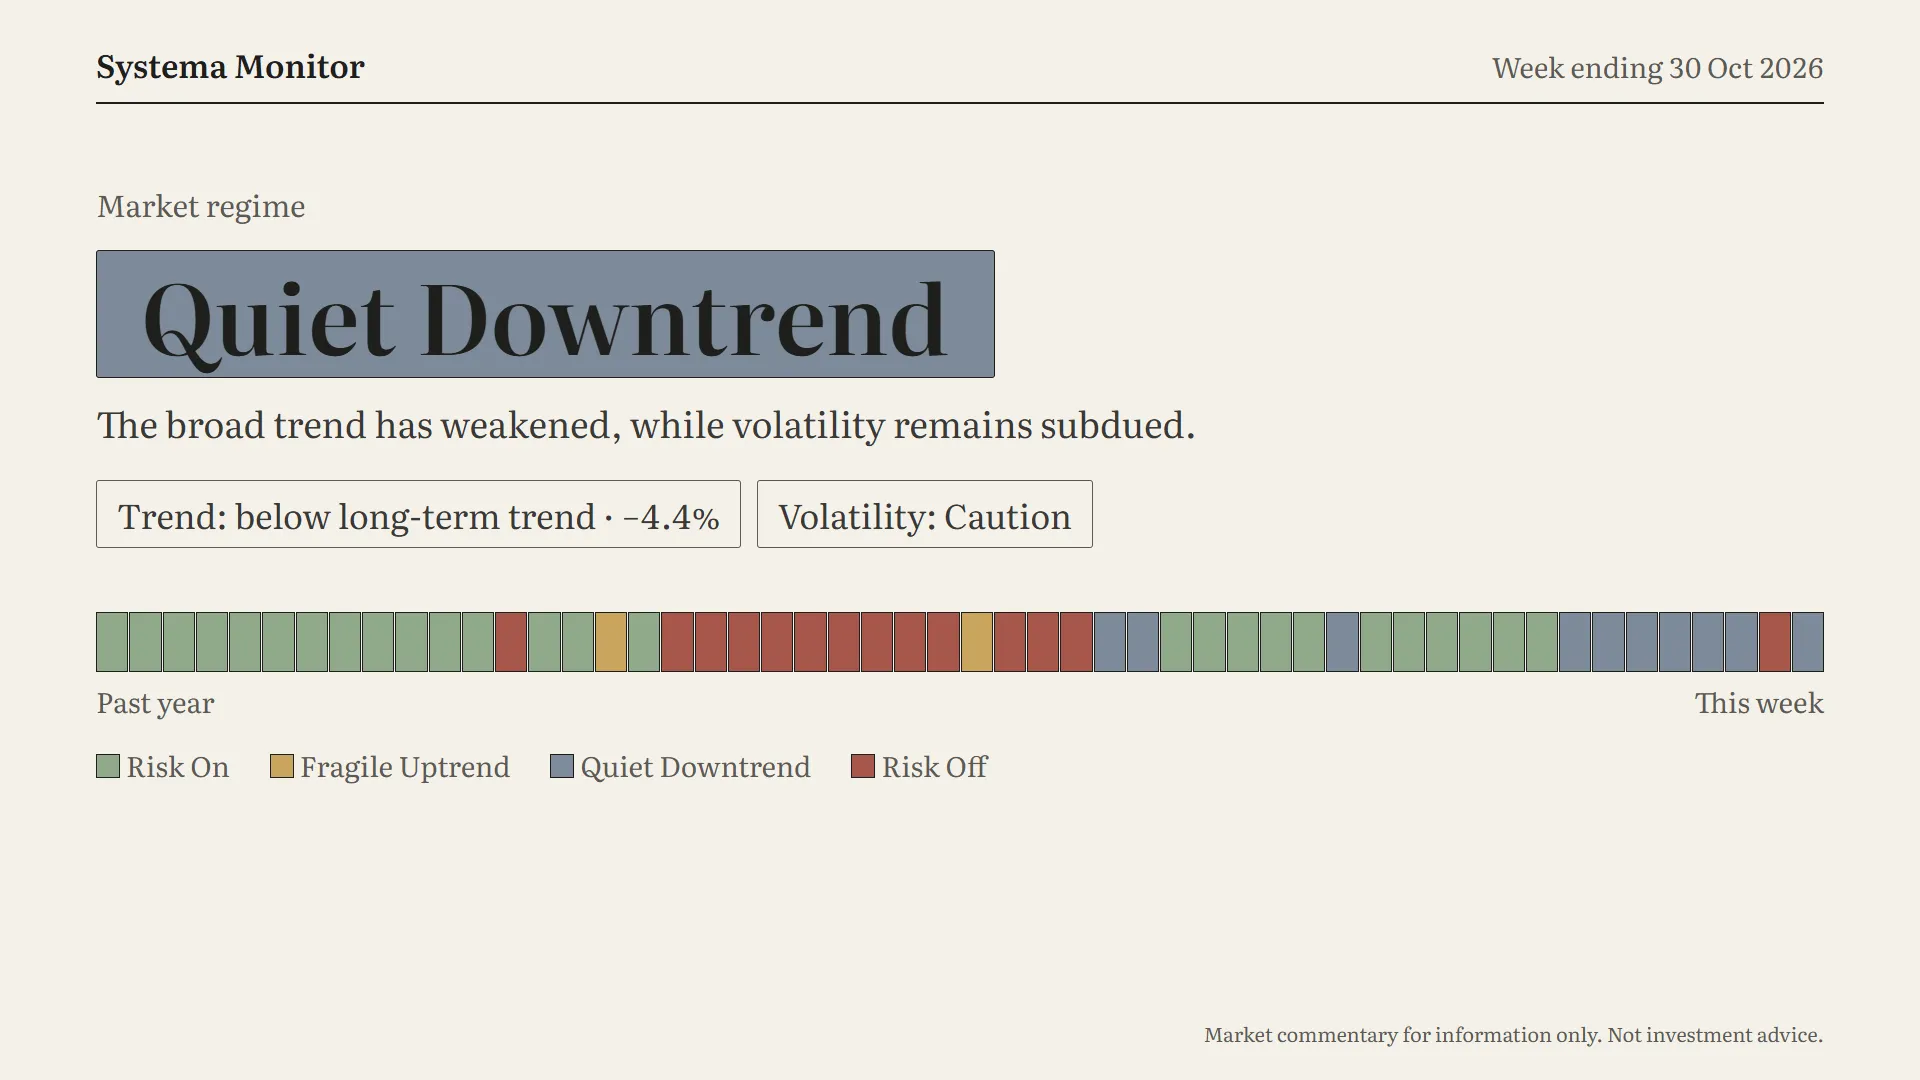
Last week was a hard one. The regime turned Risk Off, smallcaps had their worst week in our records, and momentum stocks slipped into Drawdown. This week, almost all of that turned around. Not all the way, though, and that’s the interesting part.
The market regime is back to Quiet Downtrend. The broad trend has weakened, but volatility is subdued again.
Look at the right-hand end of the strip: six slate-grey weeks, one brick-red week, and now slate-grey again. Risk Off lasted one week.
Both readings eased. Trend: the broad market is still below its long-term trend, but by about four and a half percent, down from six and a half last week. Volatility has come down from High back to Caution.
So the market has stepped back from the edge. It’s still in a downtrend, though, and it’s still below where it was two weeks ago.
Scoreboard
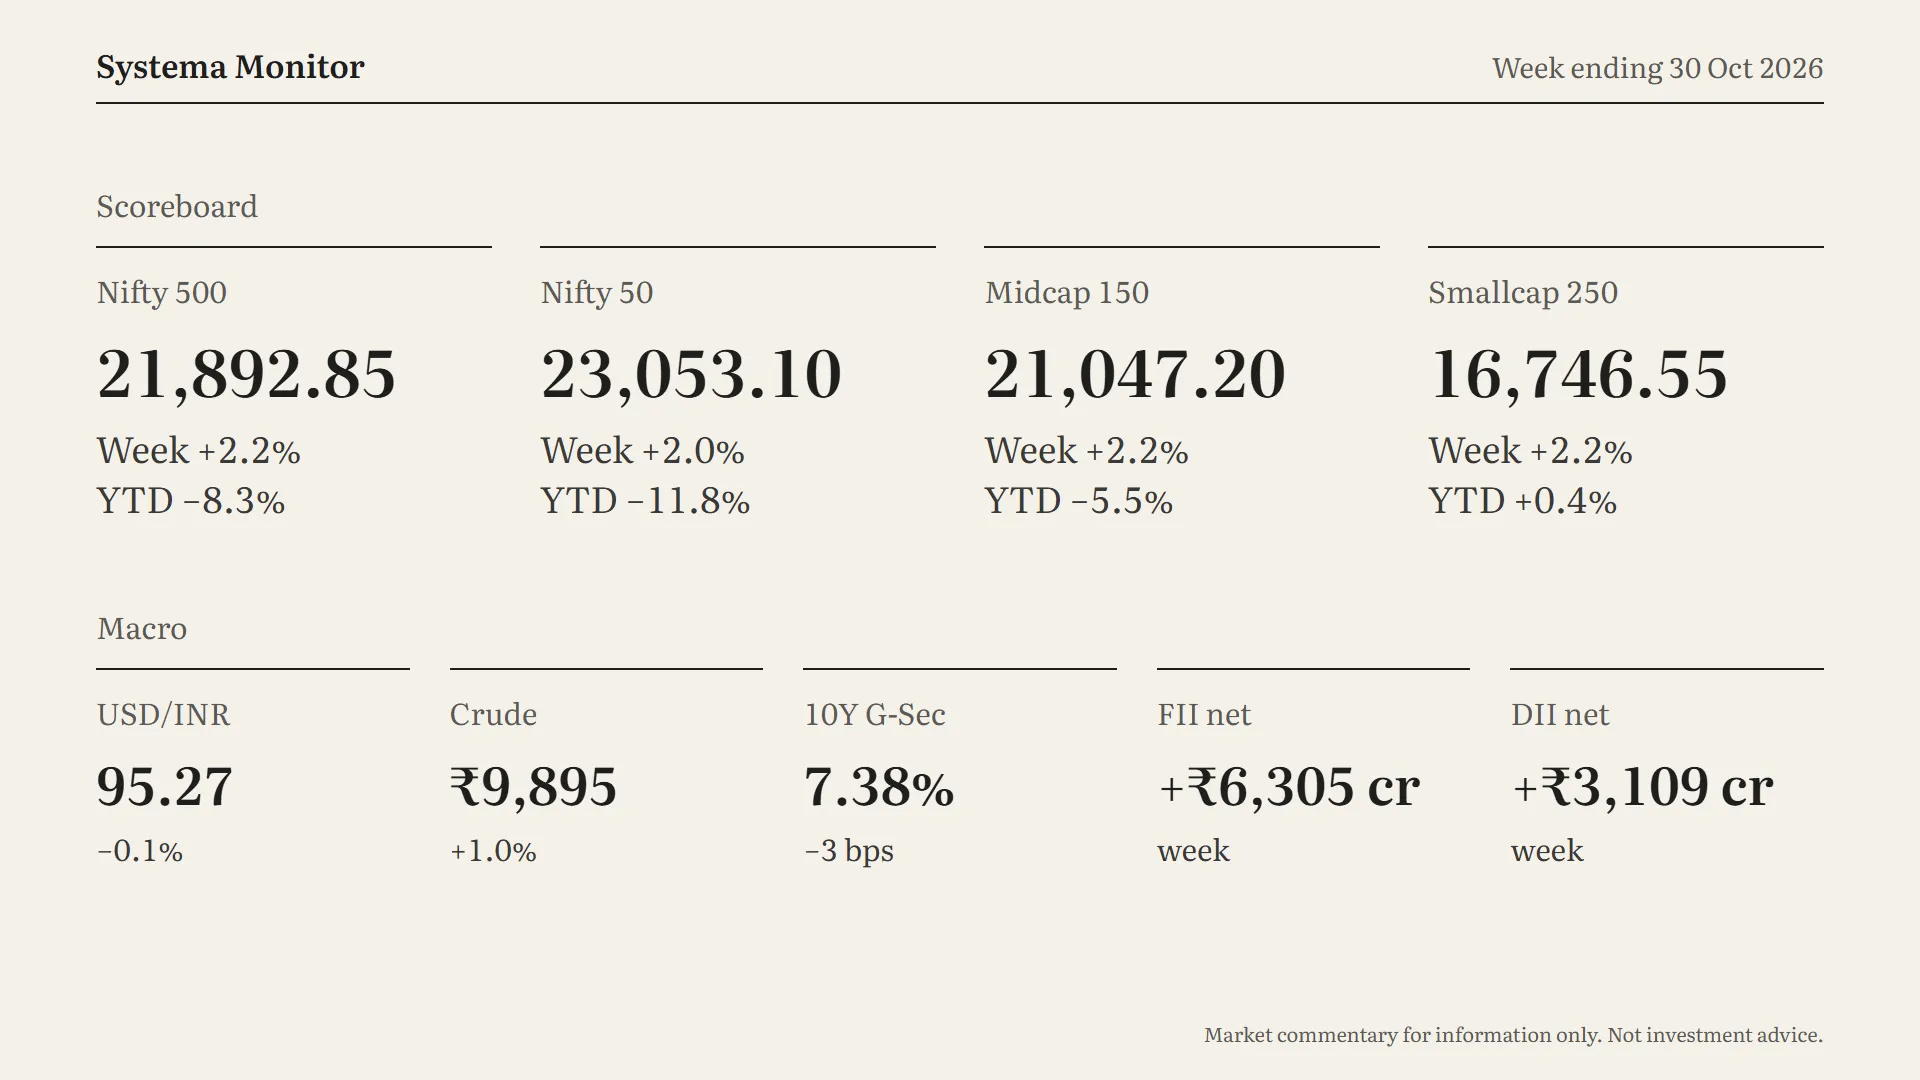
The scoreboard tells a neat story this week. Every index rose by about the same amount.
The Nifty 500 rose 2.2%, to 21,893. It’s down about eight percent for the year.
The Nifty 50 rose 2%, to 23,053. It’s down almost twelve percent for the year.
Midcaps rose 2.2%, and smallcaps rose 2.2%.
That’s different from the bounce two weeks ago, when the largest companies did most of the lifting. This time all sizes rose together.
But equal percentage gains don’t mean equal recovery. The Nifty 500 has now made back more than half of last week’s fall. Smallcaps fell much further last week, so they’ve made back only about a quarter of it. They’re back in positive territory for the year, but only just, up less than half a percent.
On to macro.
The rupee was steady, at about 95.3. The contract in the chart has rolled to November, so the level doesn’t line up exactly with last week’s.
Crude rose another 1%, to ₹9,895. That’s its third week up in a row.
The 10-year government bond yield eased to 7.38%. It’s the first weekly fall since we started tracking it here in September.
And the big change was in flows. For the first time since we started tracking flows in this report, foreign investors were net buyers for the week, of about sixty-three hundred crore rupees. They bought on three of the five days. Domestic institutions bought too, about thirty-one hundred crore.
Remember where we were: more than thirty thousand crore of foreign selling in each of the two weeks around the start of October. Since then it slowed to nine thousand, then under three thousand, and now it has turned into buying. That’s the flow story of the month.
Breadth & Momentum
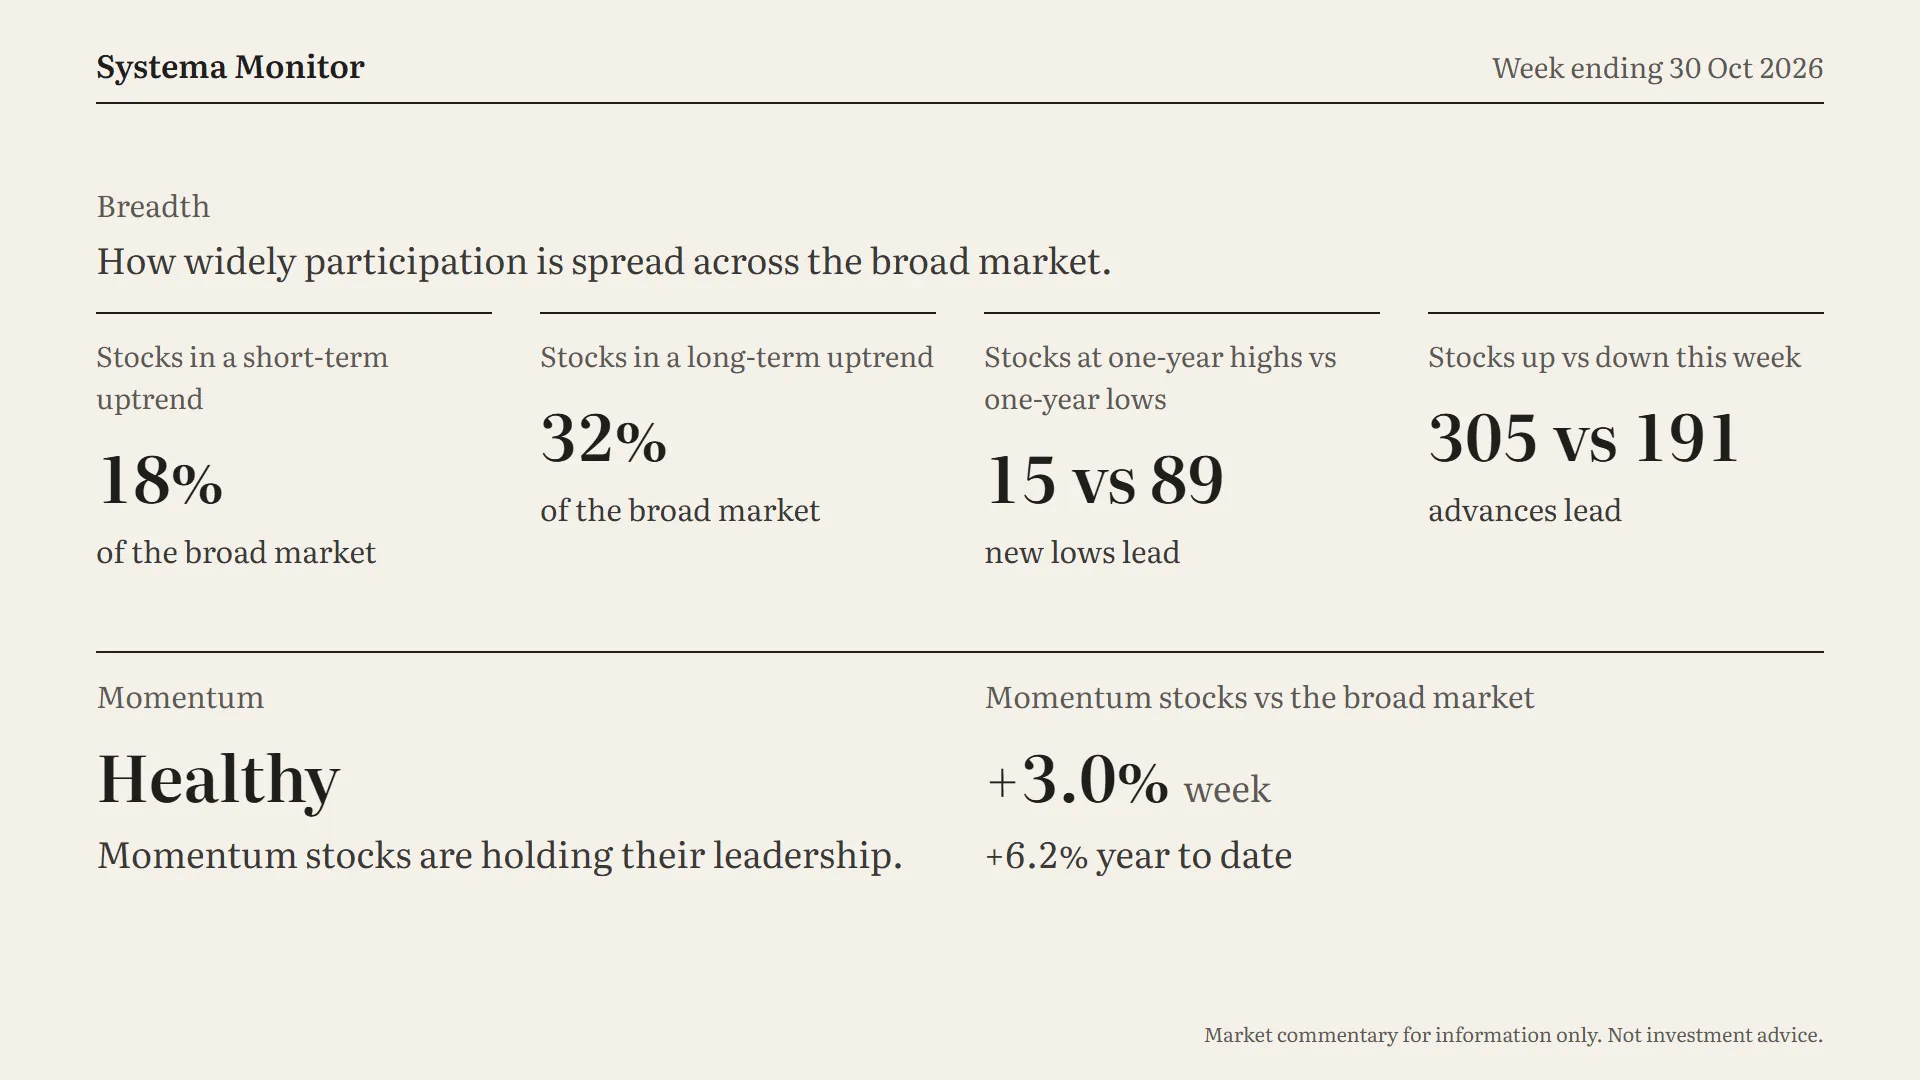
Breadth recovered, but not all of it.
Stocks up versus down: 305 rose this week, and 191 fell. Last week only 33 rose.
One-year highs versus lows: 15 new highs against 89 new lows. That’s down from 118 new lows last week, but still a lot of stocks making fresh lows.
Short-term uptrend: 18% of the broad market, up from 10%.
Long-term uptrend: 32%, up from 25%.
Here’s the useful comparison. Two weeks ago, before the sell-off, those last two numbers were 22% and 39%. So breadth has made back part of last week’s damage, not all of it. The index bounced faster than the typical stock.
Now momentum, the best news on the board. Momentum stocks are back to Healthy, so the Drawdown status lasted a single week. This week they beat the broad market by about 3%. That’s their strongest week against the market since April.
Last week we said the leaders had lagged on the way up and fallen further on the way down. This week they led on the way up. Their lead for the year is back to about six percentage points, up from three last week.
Sector Leadership
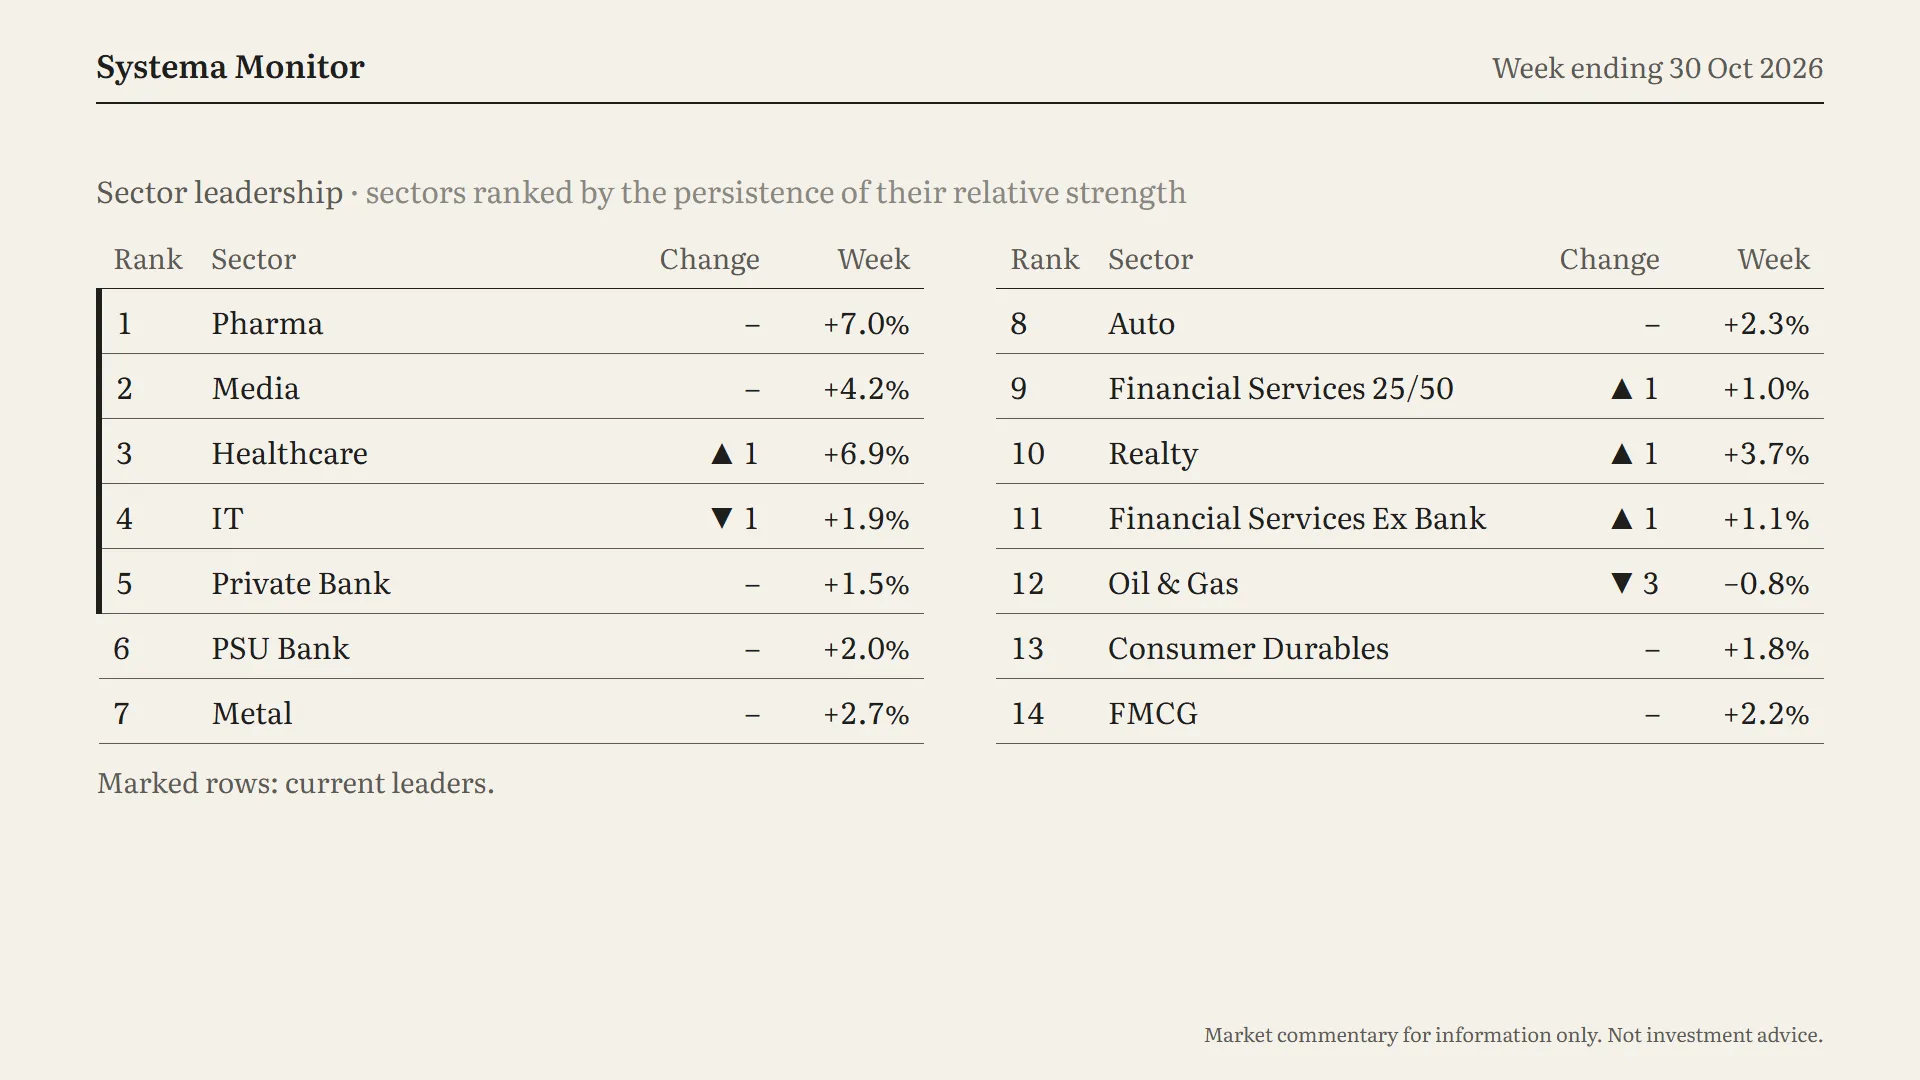
Sector leadership. As always, this table ranks sectors by how persistently they’ve been strong.
Last week, every sector fell except IT. This week was the mirror image: every sector rose except one, oil and gas, which slipped 0.8% and dropped three places to twelfth.
The same five leaders hold, and they did a lot of this week’s work:
- Pharma stays at number one, and was the best performer of the week, up 7%.
- Media holds second, up 4.2%.
- Healthcare moved up to third, up 6.9%.
- IT slipped one place to fourth, but still gained 1.9%. It stays among the leaders in its second week there.
- Private banks hold fifth.
That’s why momentum had such a strong week. The sectors that have led persistently, pharma and healthcare above all, were also this week’s biggest gainers.
Further down, Metal stays at seventh after dropping out of the leaders last week. Realty gained 3.7% and climbed a place, to tenth.
Week Ahead
First, a quick look back at last week’s central bank meetings. The Bank of Japan kept its interest rate unchanged.
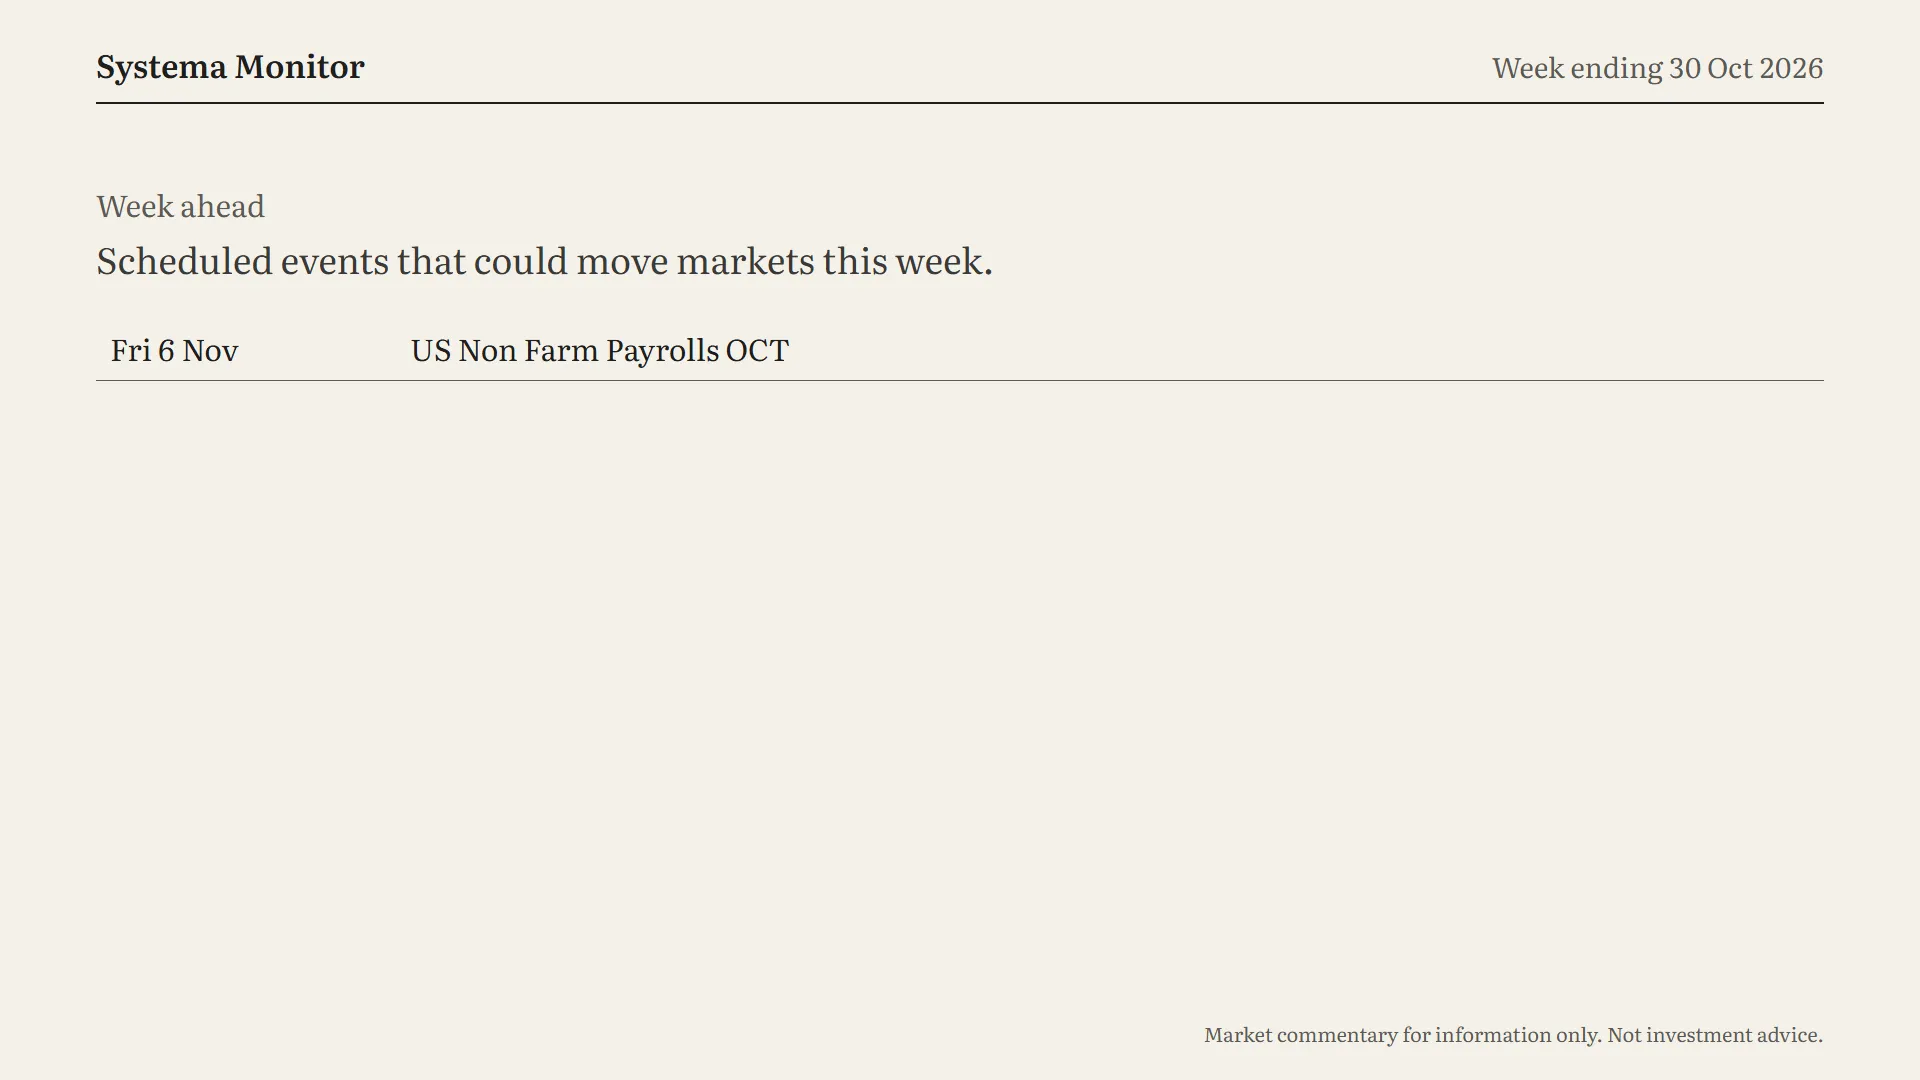
The week ahead:
- Friday, 6 November: US jobs data for October, the non-farm payrolls report.
With foreign investors just turning buyers, US data that moves the dollar and global rates is worth watching.
To sum up: the market took last week’s Risk Off and turned around. The regime is back to Quiet Downtrend, and volatility is back to Caution. Every index rose about two percent, and every sector but one gained. Foreign investors were net buyers for the first time in this stretch. Momentum stocks are Healthy again, after their strongest week against the market since April. But breadth has only half-recovered, new lows still far outnumber new highs, and the broad market is still below its long-term trend.
That’s Systema Monitor for this week. Thanks for reading and see you next week.
For trade breakdowns of what I traded during the week, kindly watch this.

Referral link. *T&Cs apply. Investment in securities market are subject to market risks, read all the related documents carefully before investing. For a detailed disclaimer visit https://zerodha.com/pricing. Member ID NSE (13906), BSE (6498), MCX (46025). Brokerage will not exceed the SEBI prescribed limit.
Get new lessons by email
One email when a new article is published, free. Unsubscribe any time. We only use your email to send the newsletter; see the privacy policy.