Systema Monitor (Week 43)
Week ending 23 October: the regime turns Risk Off, smallcaps fall 7%, only 33 stocks rise, and momentum stocks slip into Drawdown.
Market data in this review is as of 23 October 2026.
 Watch the video: Systema Monitor (Week 43)
This is market commentary for information only. It’s not investment advice.
Hello, and welcome to Systema Monitor for the week ending the twenty-third of October.
Market Regime
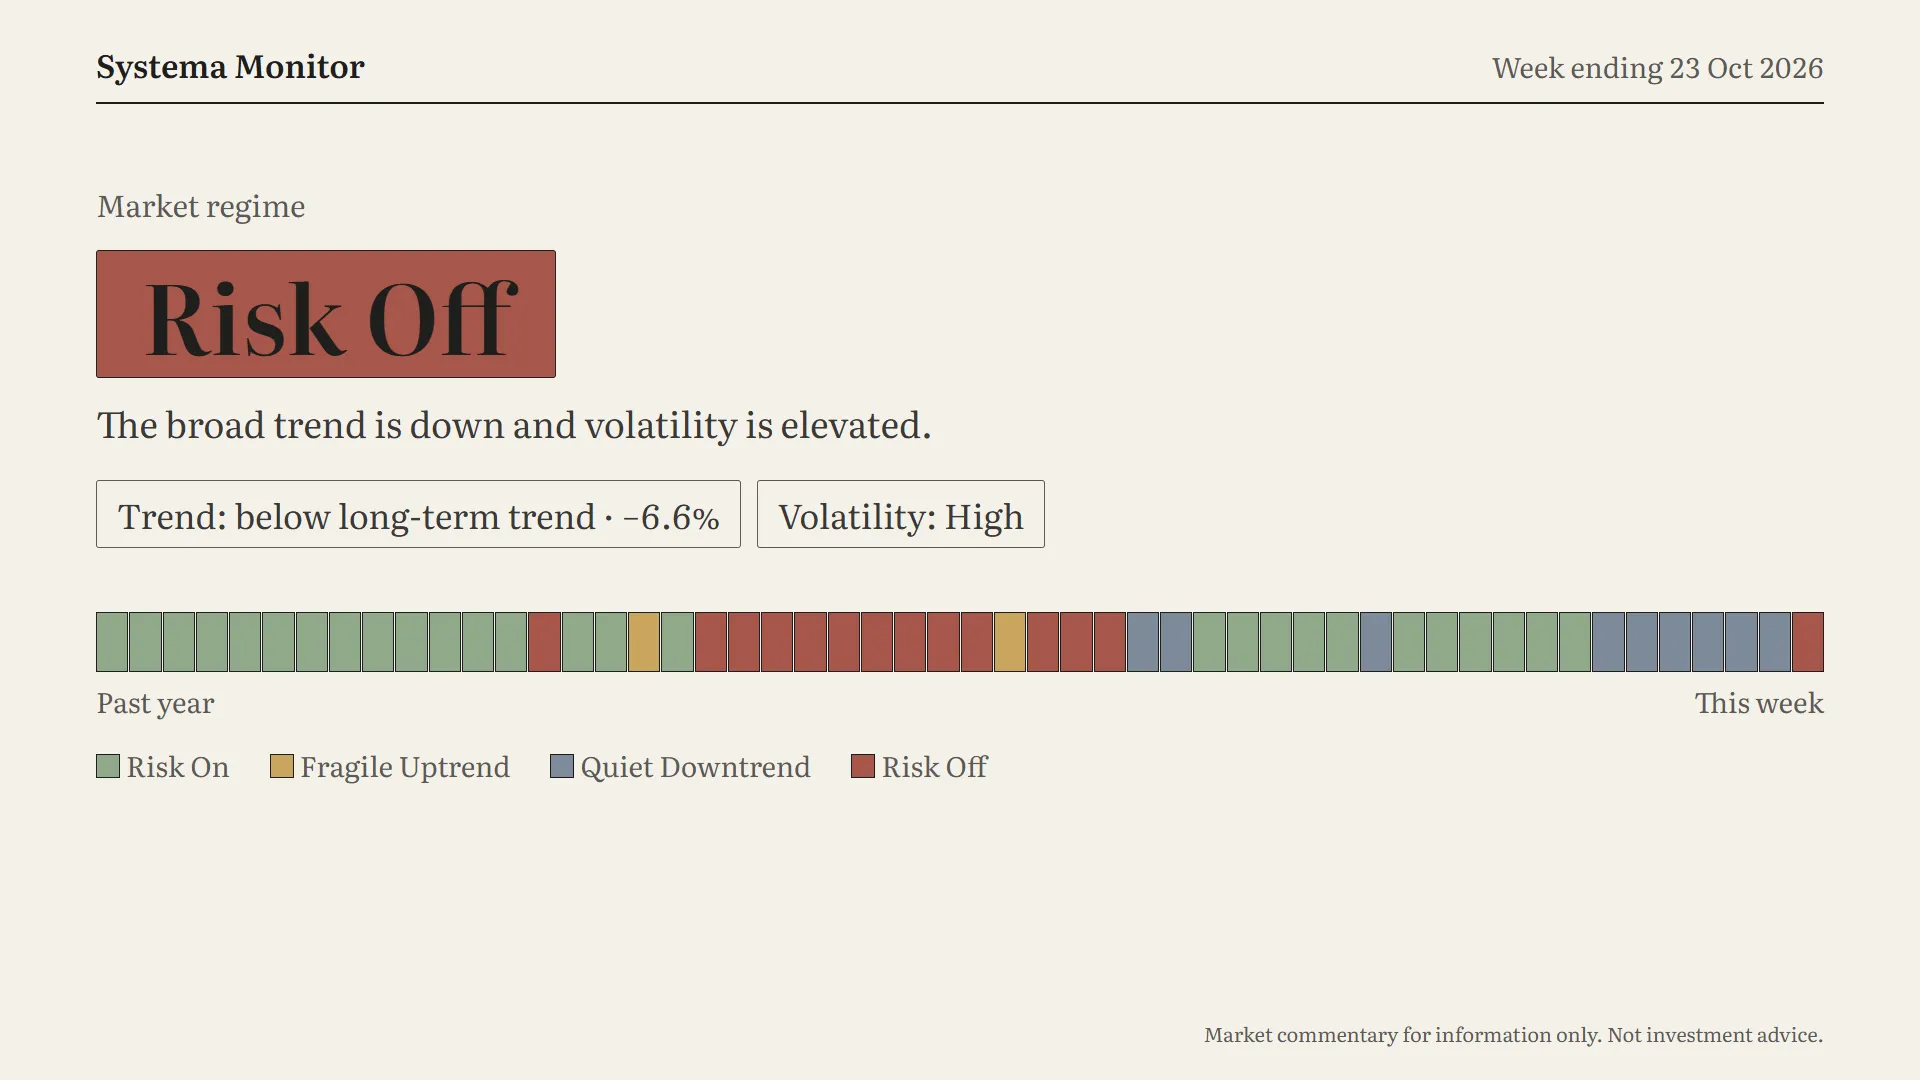
Last week we talked about a rally led by the year’s laggards. We also said one thing to watch was momentum stocks falling behind. This week the rally is gone, momentum stocks fell further behind, and the regime changed colour.
The market regime is now Risk Off. That means the broad trend is down and volatility is elevated.
That’s a change after six weeks of Quiet Downtrend. Look at the right-hand end of the strip: six slate-grey blocks, and now a brick-red one. It’s the first Risk Off week since the end of May, nearly five months ago.
Both readings got worse. Trend: last week the broad market was about three percent below its long-term trend. This week it’s six and a half percent below. So last week’s bounce has been more than undone. Volatility moved up from Caution to High.
In plain terms, the market went from a quiet slide to a market that is falling and nervous. This was also a short week, four trading days, with Tuesday a market holiday. That makes the size of the fall stand out more.
Scoreboard
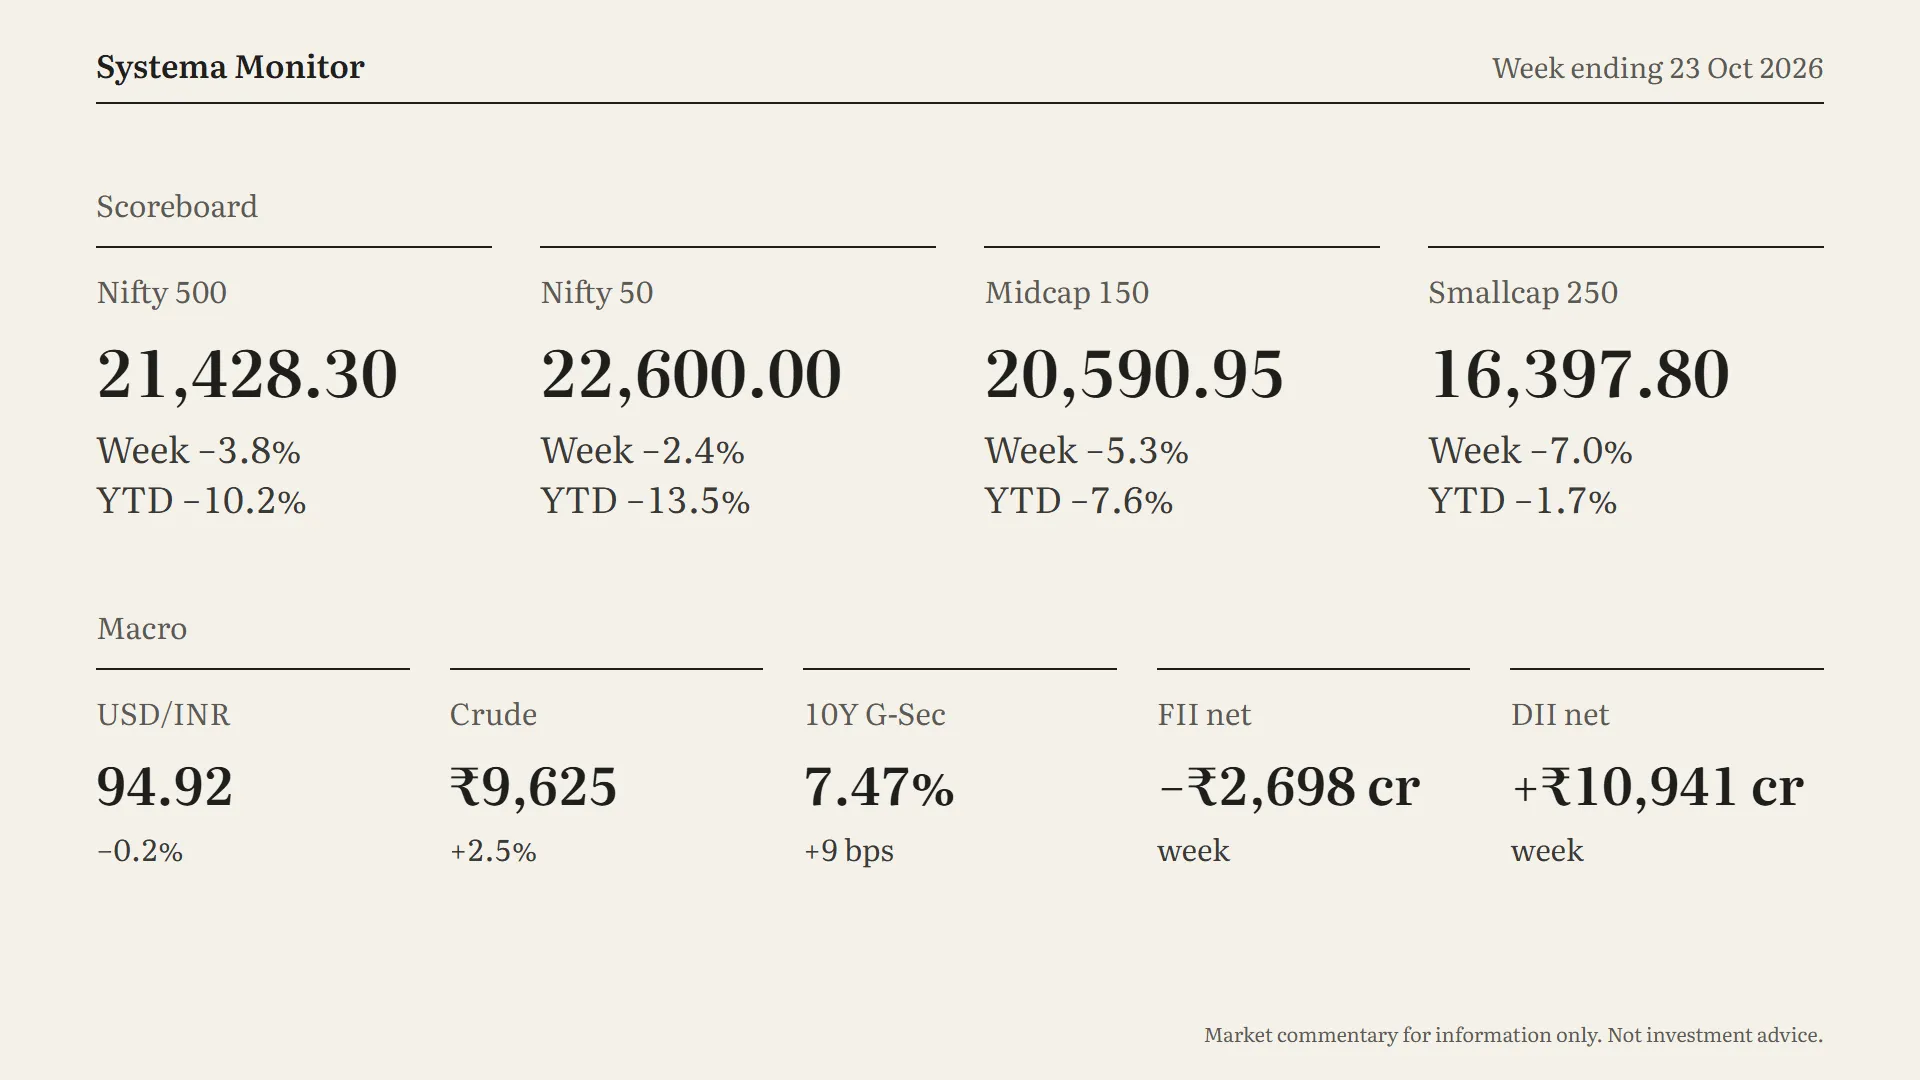
The scoreboard shows where the damage was.
The Nifty 500 fell 3.8%, to 21,428. That’s below where it was two weeks ago, before last week’s bounce. It’s now down just over ten percent for the year, the first time it’s been that far down since April.
The Nifty 50 held up best, but still fell 2.4%, to 22,600. It’s down about thirteen and a half percent for the year.
And then the smaller companies. Midcaps fell 5.3%, and smallcaps fell 7%. Those are the worst weekly falls for both since our records began, more than a year ago.
That changes the year’s picture. Last week, smallcaps were still up almost six percent for the year. Now they’re down, by nearly two percent. All of the year’s gains in smaller companies went in a single week.
On to macro. The rupee held steady at about 94.9, after its strong week last week. Crude rose another 2.5%, to ₹9,625. One note on the number on screen: this is now the November contract, so it doesn’t line up exactly with last week’s figure. Either way, crude was up again for a second week. The 10-year government bond yield rose nine basis points, to 7.47%. That’s the fourth week in a row of rising yields. Over those four weeks it’s up about thirty-five basis points, more than a third of a percentage point.
And here’s the twist in this week’s flows. Foreign investors sold only about twenty-seven hundred crore rupees, and they were net buyers on two of the four days. Domestic institutions bought nearly eleven thousand crore.
So for the first time in this stretch, foreign selling wasn’t the main pressure. Institutions bought on balance, and the market still fell hard. The selling came from other investors.
Breadth & Momentum
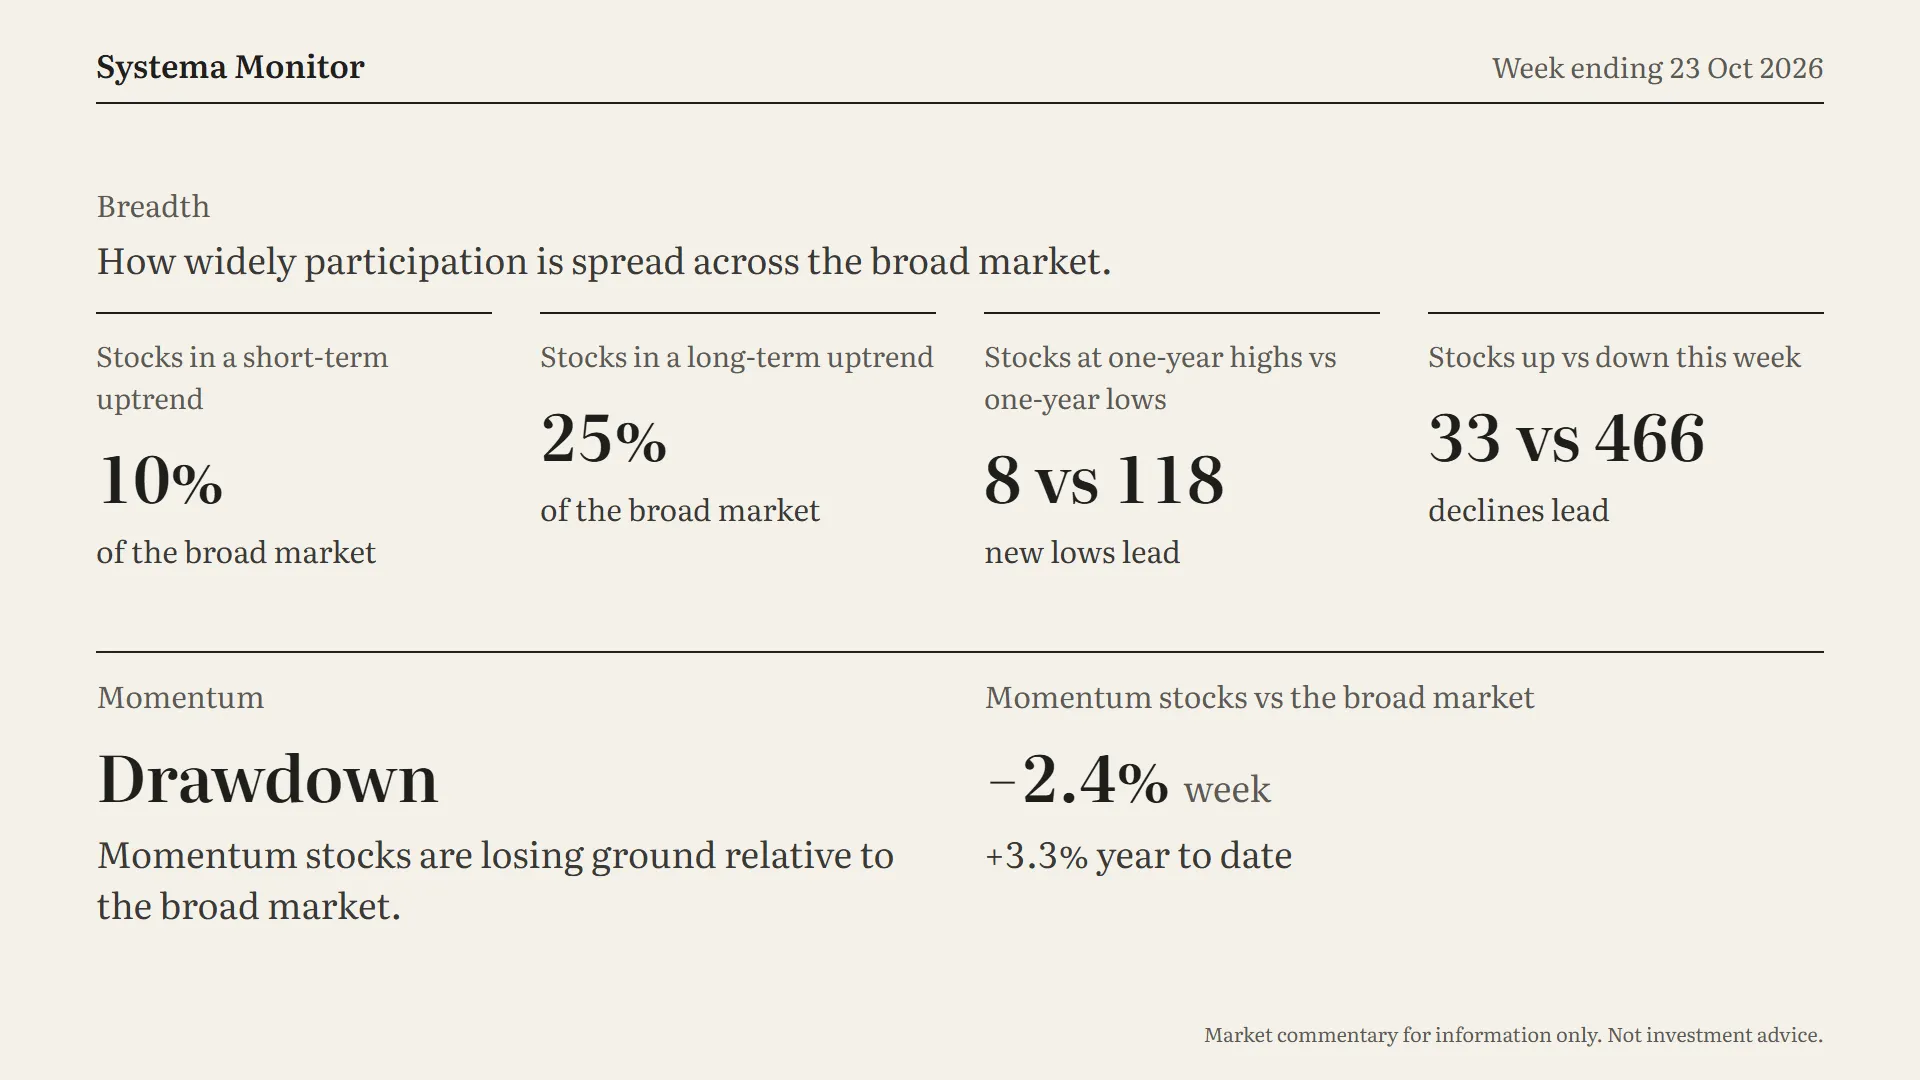
Last week, breadth improved on every measure. This week, every measure gave all of that back and then fell further.
Stocks up versus down: only 33 stocks rose this week, and 466 fell. That’s fewer risers than in any week in our records. Last week it was 322 up.
One-year highs versus lows: 8 new highs against 118 new lows. Last week there were only 35 new lows. This is the highest count of new lows since March.
Short-term uptrend: just 10% of the broad market. That’s the lowest reading in our records. Only one stock in ten is in a short-term uptrend.
Long-term uptrend: 25%, down from 39% in one week. Three out of every four stocks are now below their long-term trend.
So it wasn’t a few heavy names dragging the index down. Nearly the whole market sold off.
Now momentum, and this is the change we flagged last week. The status has moved from Healthy to Drawdown, which means momentum stocks are losing ground relative to the broad market. It’s the first time we’ve been in this state since March.
Here’s why it matters. Last week, in a rally, momentum stocks trailed the market by 2.6%. This week, in a sell-off, they trailed again, by 2.4%. So the leaders lagged on the way up and fell further on the way down. They’re still ahead of the broad market for the year, by about three percentage points. But two weeks ago that lead was more than eight.
Sector Leadership
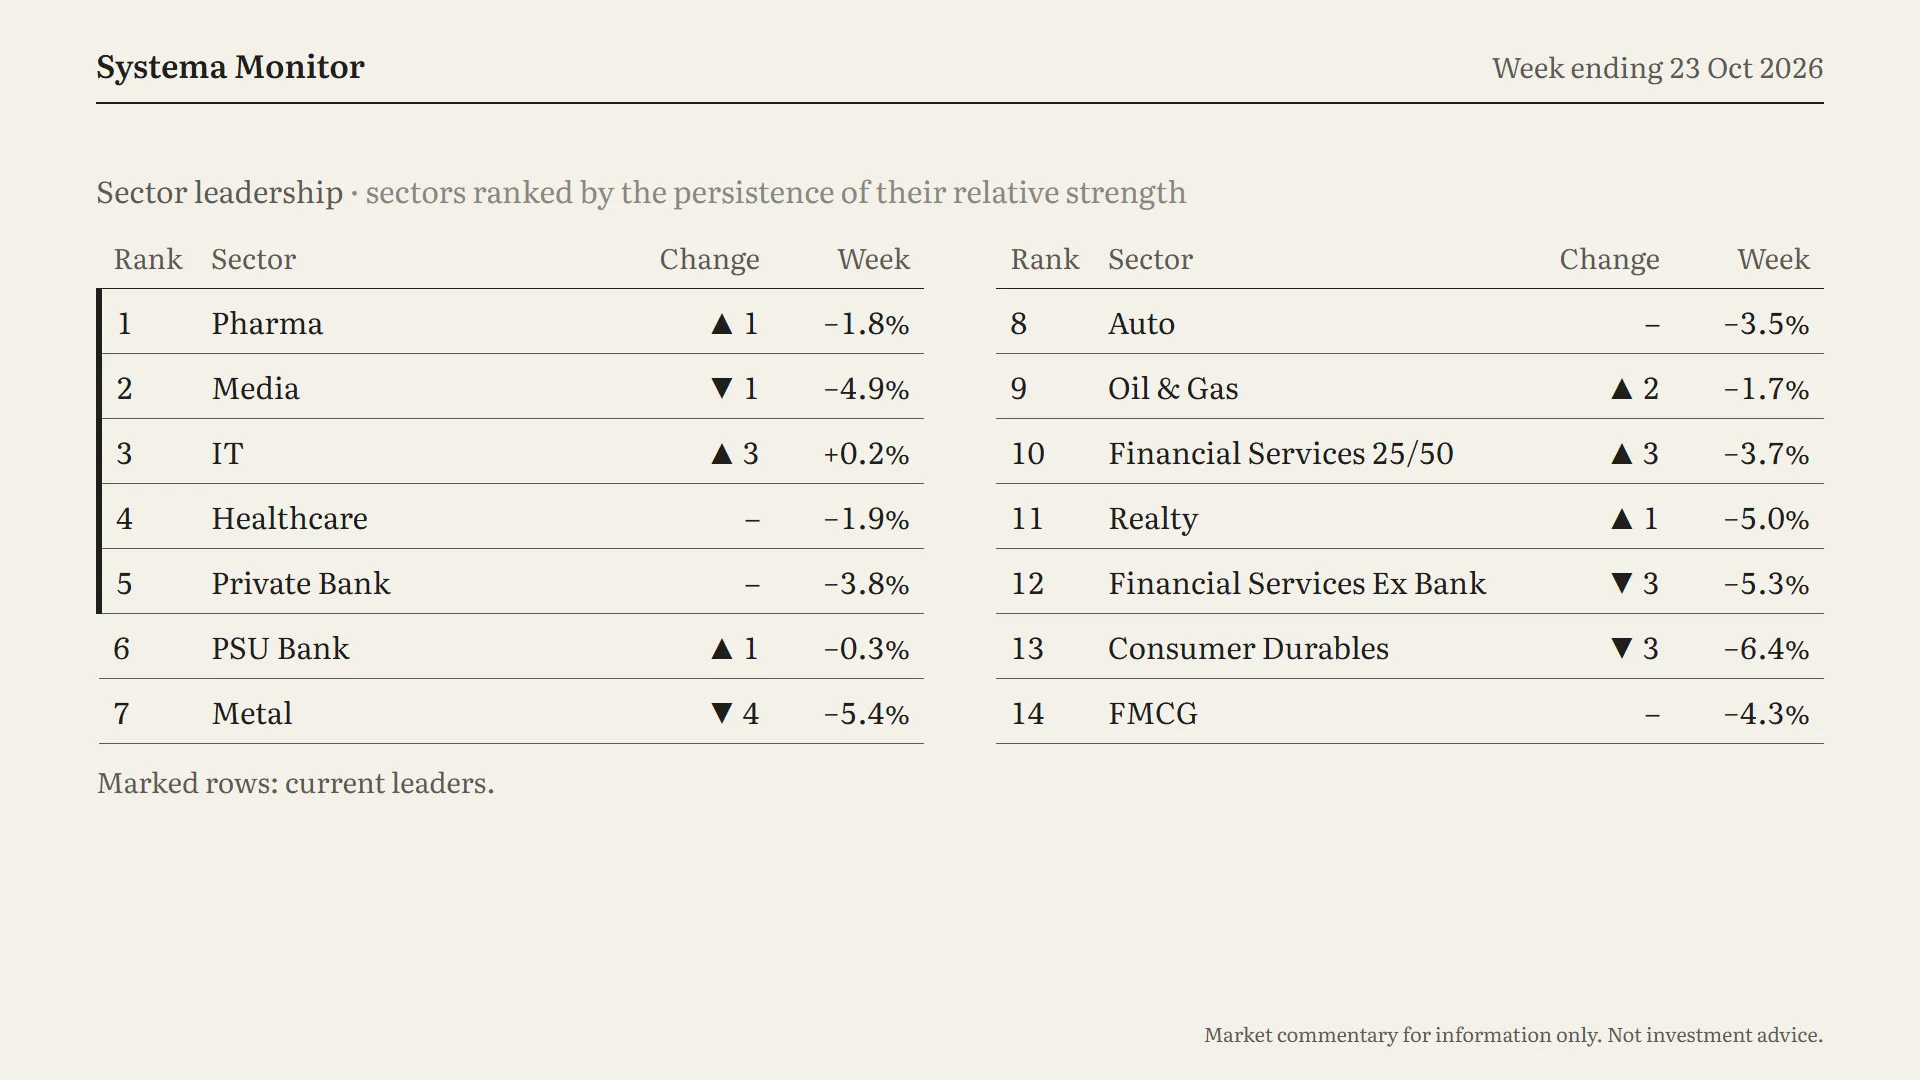
Sector leadership. As always, this ranks sectors by how persistently they’ve been strong.
First, the week itself. Every sector on this table fell, except one: IT, which edged up 0.2%.
Last week we said IT’s twelve percent jump wasn’t enough on its own. To join the leaders, it had to keep it up. It did, holding its gains in a week when everything else fell. IT has joined the leaders, climbing three places to third.
The leaders now:
- Pharma is back at number one.
- Media slipped to second, after a 4.9% fall.
- IT is new to the leaders, at third.
- Healthcare held fourth.
- Private banks held fifth.
The sector that dropped out is Metal. It fell 5.4% this week and dropped four places to seventh.
Elsewhere, the defensive groups held up best. Pharma and healthcare each fell less than 2%, and PSU banks barely moved. The heaviest fall on the table was consumer durables, down 6.4%, and it slipped three places to thirteenth.
Week Ahead
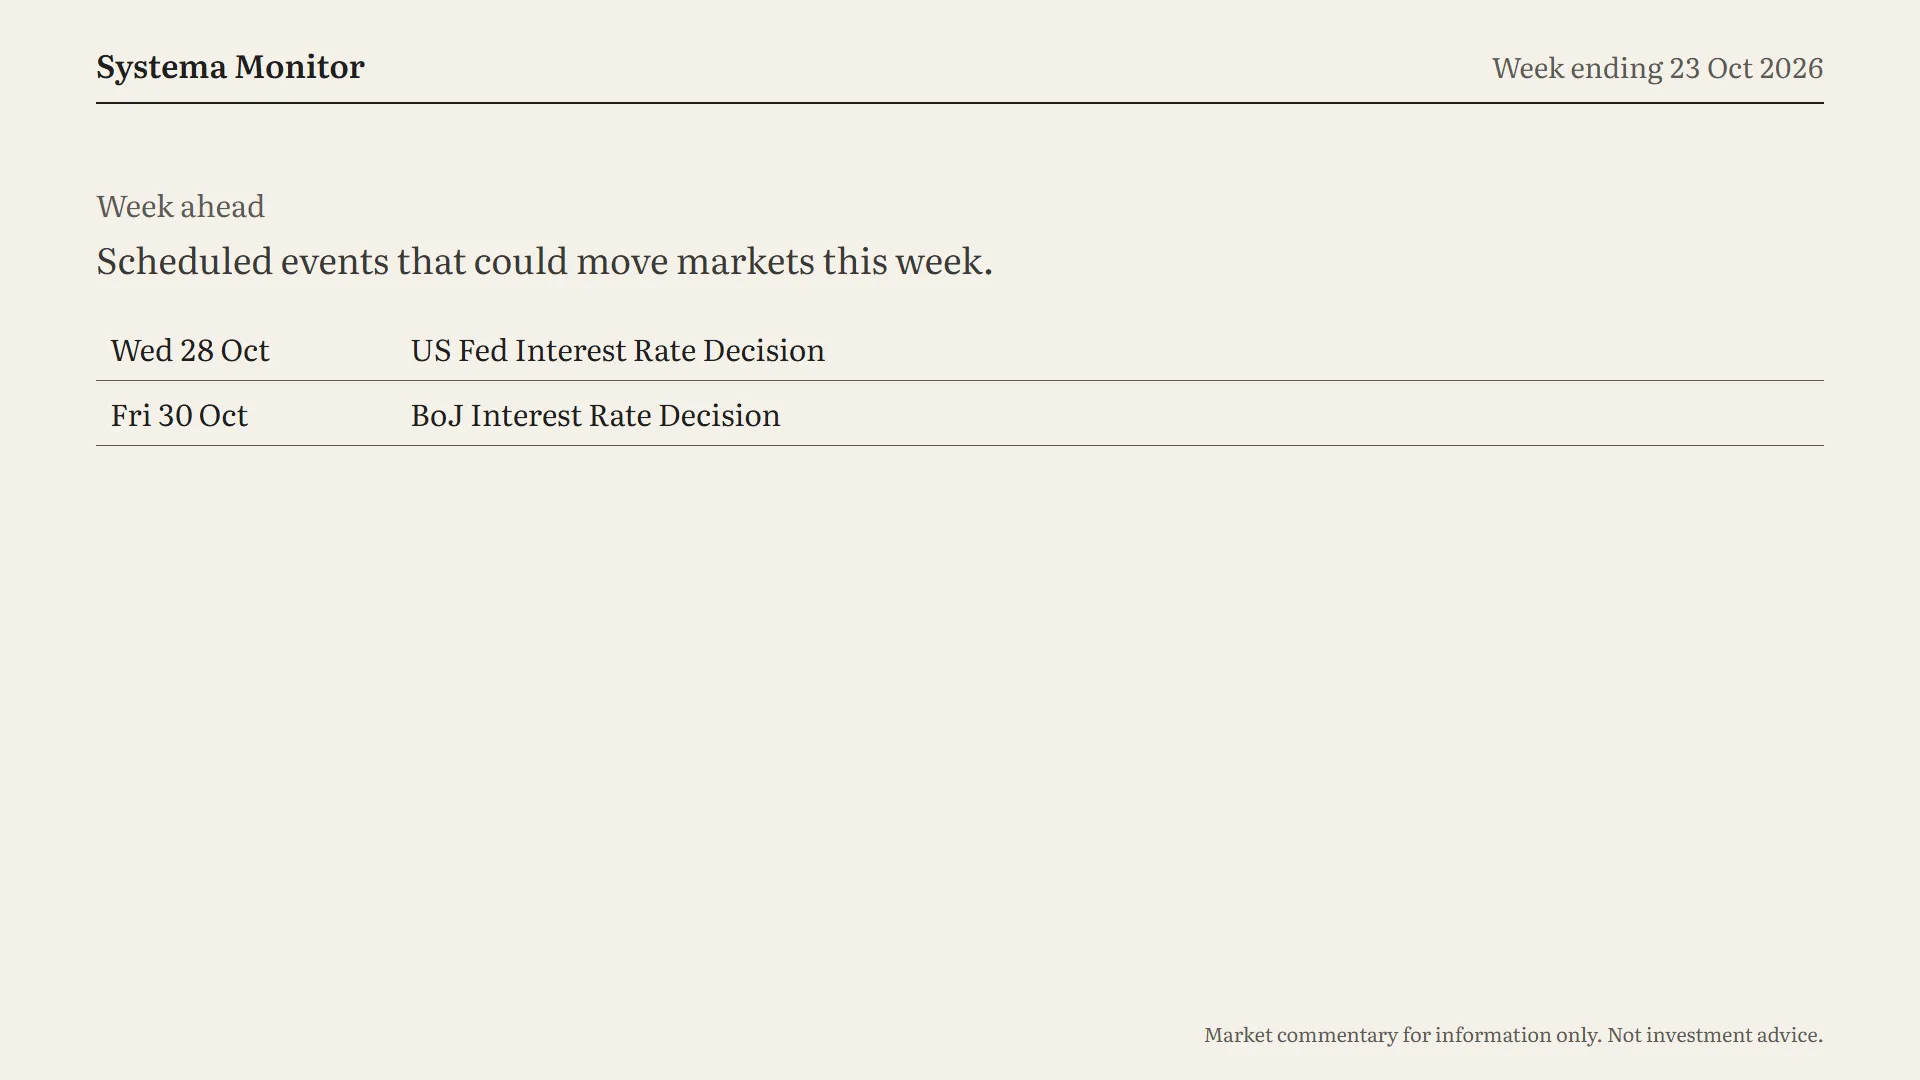
Finally, the week ahead, which is all about central banks.
- Wednesday, 28 October: the US Federal Reserve’s interest rate decision.
- Friday, 30 October: the Bank of Japan’s interest rate decision.
With Indian bond yields up four weeks running and volatility now High, both decisions matter for how money moves next.
To sum up: last week’s bounce didn’t last. The regime has moved to Risk Off, the first time since May. Smallcaps and midcaps had their worst week in more than a year, and nearly every stock fell. This time foreign investors weren’t the main sellers. Momentum stocks are now in Drawdown, having lagged in both the rally and the fall. The one bright spot on the board was IT, which has now earned its place among the leaders.
That’s Systema Monitor for this week. Thanks for reading and see you next week.
For trade breakdowns of what I traded during the week, kindly watch this.

Referral link. *T&Cs apply. Investment in securities market are subject to market risks, read all the related documents carefully before investing. For a detailed disclaimer visit https://zerodha.com/pricing. Member ID NSE (13906), BSE (6498), MCX (46025). Brokerage will not exceed the SEBI prescribed limit.
Get new lessons by email
One email when a new article is published, free. Unsubscribe any time. We only use your email to send the newsletter; see the privacy policy.