Systema Monitor (Week 42)
Week ending 16 October: a broad bounce led by the largest companies and IT, while momentum stocks gave back some of their lead. Still Quiet Downtrend.
Market data in this review is as of 16 October 2026.
 Watch the video: Systema Monitor (Week 42)
This is market commentary for information only. It’s not investment advice.
Hello, and welcome to Systema Monitor for the week ending the sixteenth of October.
After two difficult weeks, the market finally bounced. The Nifty 500 rose almost two percent, and more stocks joined in than we’ve seen for a while. But look at who led the rally, because that’s the real story this week.
Market Regime
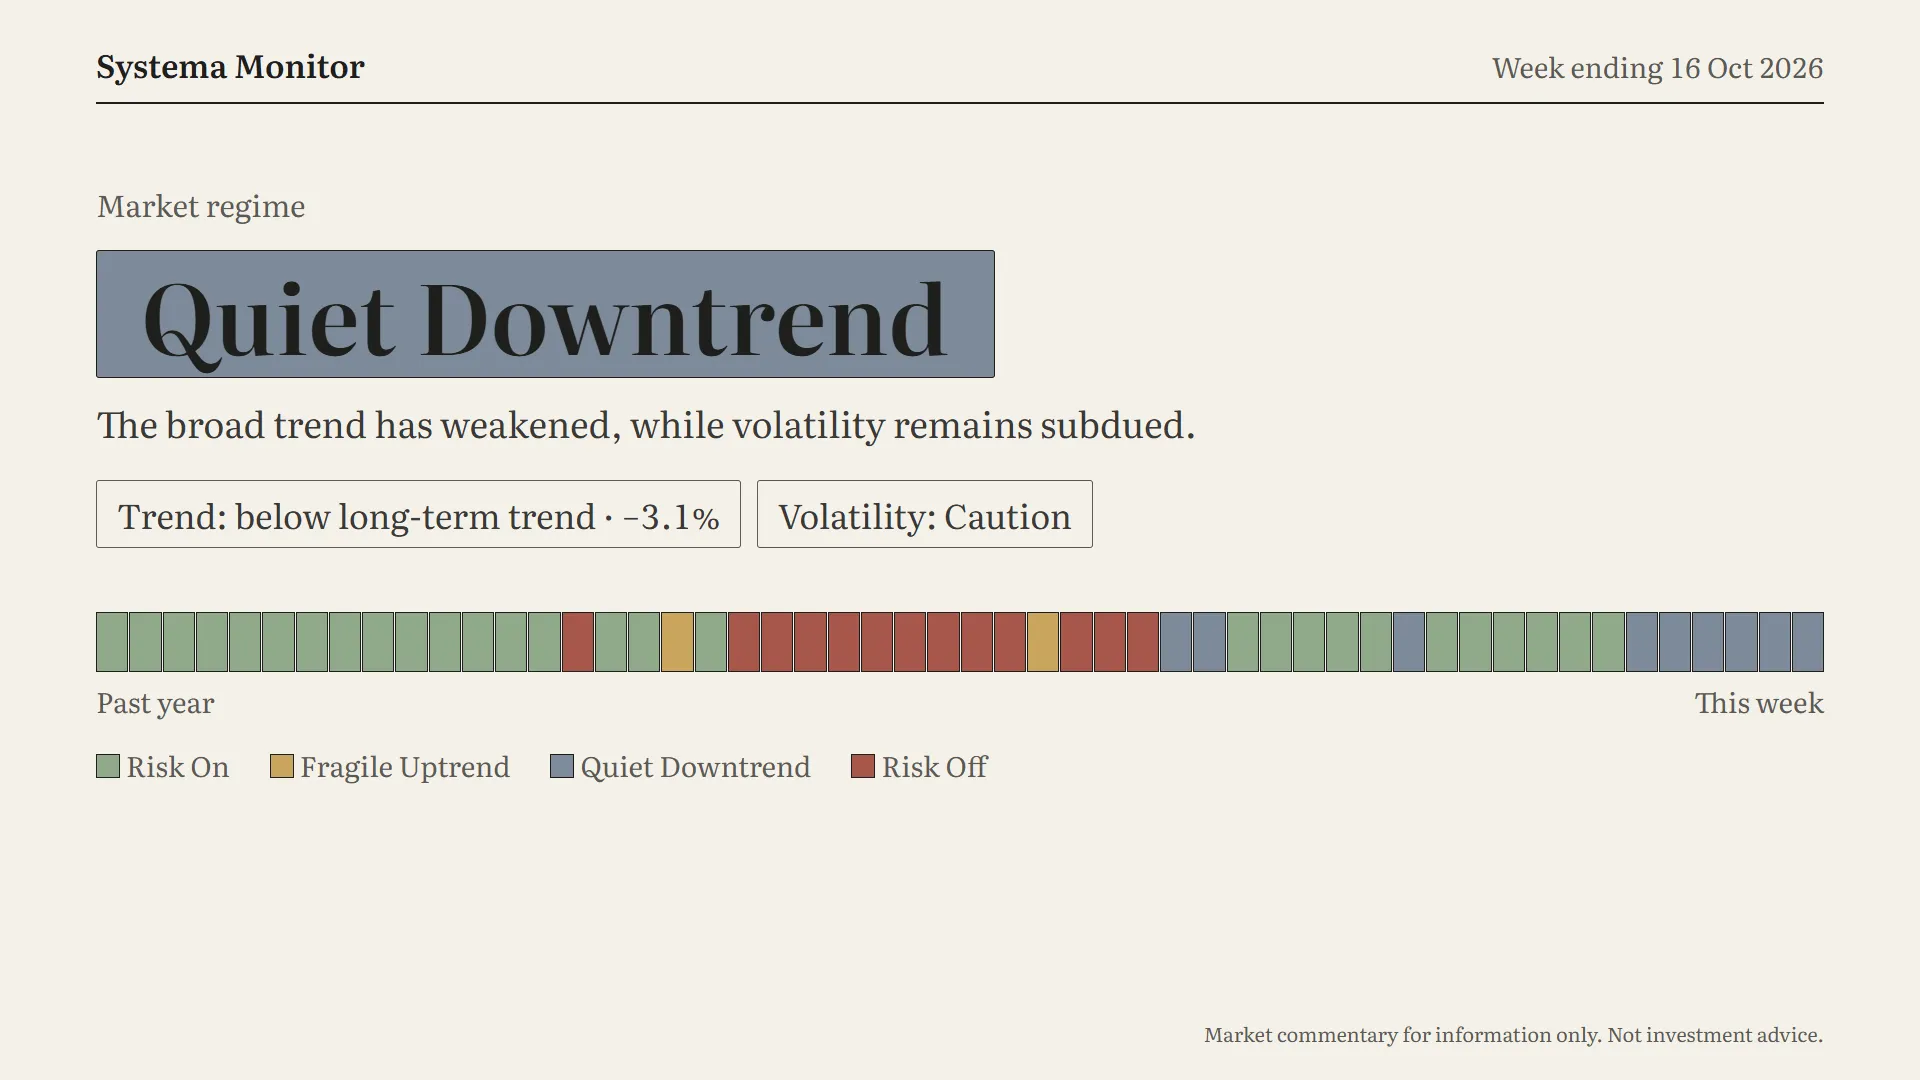
First, the market regime. It’s still Quiet Downtrend. The broad trend has weakened, but volatility is subdued.
This is the sixth week in a row in this regime, and the strip across the bottom shows it: six slate-grey blocks at the right-hand end. That’s still the longest run of this regime in the past year.
What has changed is the distance. Trend: the broad market is still below its long-term trend, but the gap has narrowed. Last week it was about five percent. This week it’s about three. One good week has closed a good part of it, though not all.
Volatility still reads Caution. It’s higher than usual compared with its own recent history, but it’s eased a little since last week.
So the regime hasn’t changed, but the market is closer to its trend than it has been for some weeks.
Scoreboard
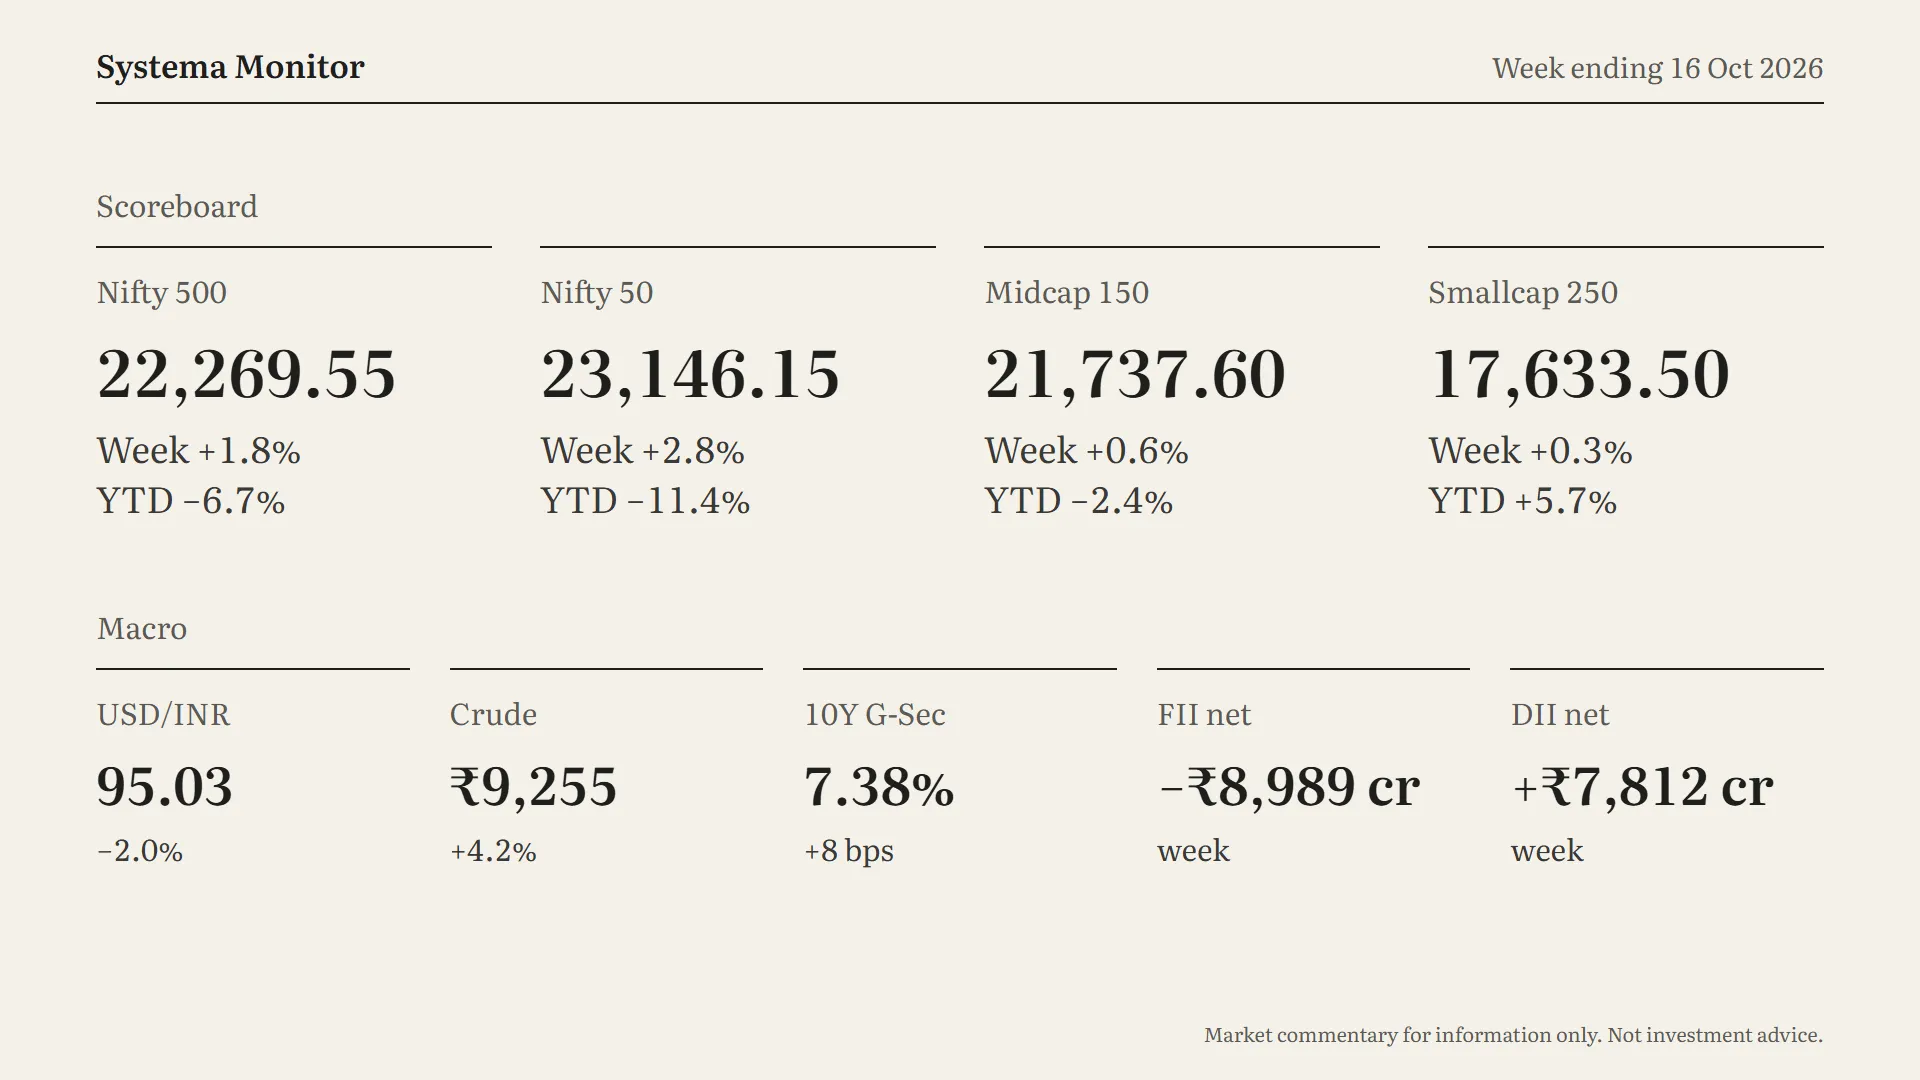
Now the scoreboard, where the pattern of the week starts to show. The Nifty 50 led, up almost 2.8%, to 23,146. That’s its best week since April. It’s still down about eleven and a half percent for the year, but that’s an improvement on nearly fourteen.
The Nifty 500 rose 1.8%, to 22,270. It’s down about six and a half percent for the year. Midcaps gained 0.6%, and smallcaps only 0.3%.
So this week the order was reversed. All year, smaller companies have done far better than larger ones. Smallcaps are still up almost six percent this year. But this week the largest companies, the year’s laggards, did the lifting.
On to macro, where there was plenty going on. The rupee strengthened sharply. USD/INR fell almost two percent to about 95.0. That’s a big move for a currency in a single week, and it went in India’s favour. Crude jumped 4.2%, to ₹9,255. Remember, that’s priced in rupees. Crude rose in rupee terms even though the rupee got stronger, so the move in the global oil price was bigger still.
The 10-year government bond yield rose another eight basis points, to 7.38%. That’s the third week in a row of rising yields, and over those three weeks the yield is up about a quarter of a percentage point.
And flows. Foreign investors were net sellers again, of about nine thousand crore rupees. Domestic institutions bought about seventy-eight hundred crore. Foreign selling is still going, but it’s much lighter than the thirty thousand crore of each of the previous two weeks. And on Friday the pattern flipped for a day: foreign investors were net buyers, and domestic institutions were net sellers.
Breadth & Momentum
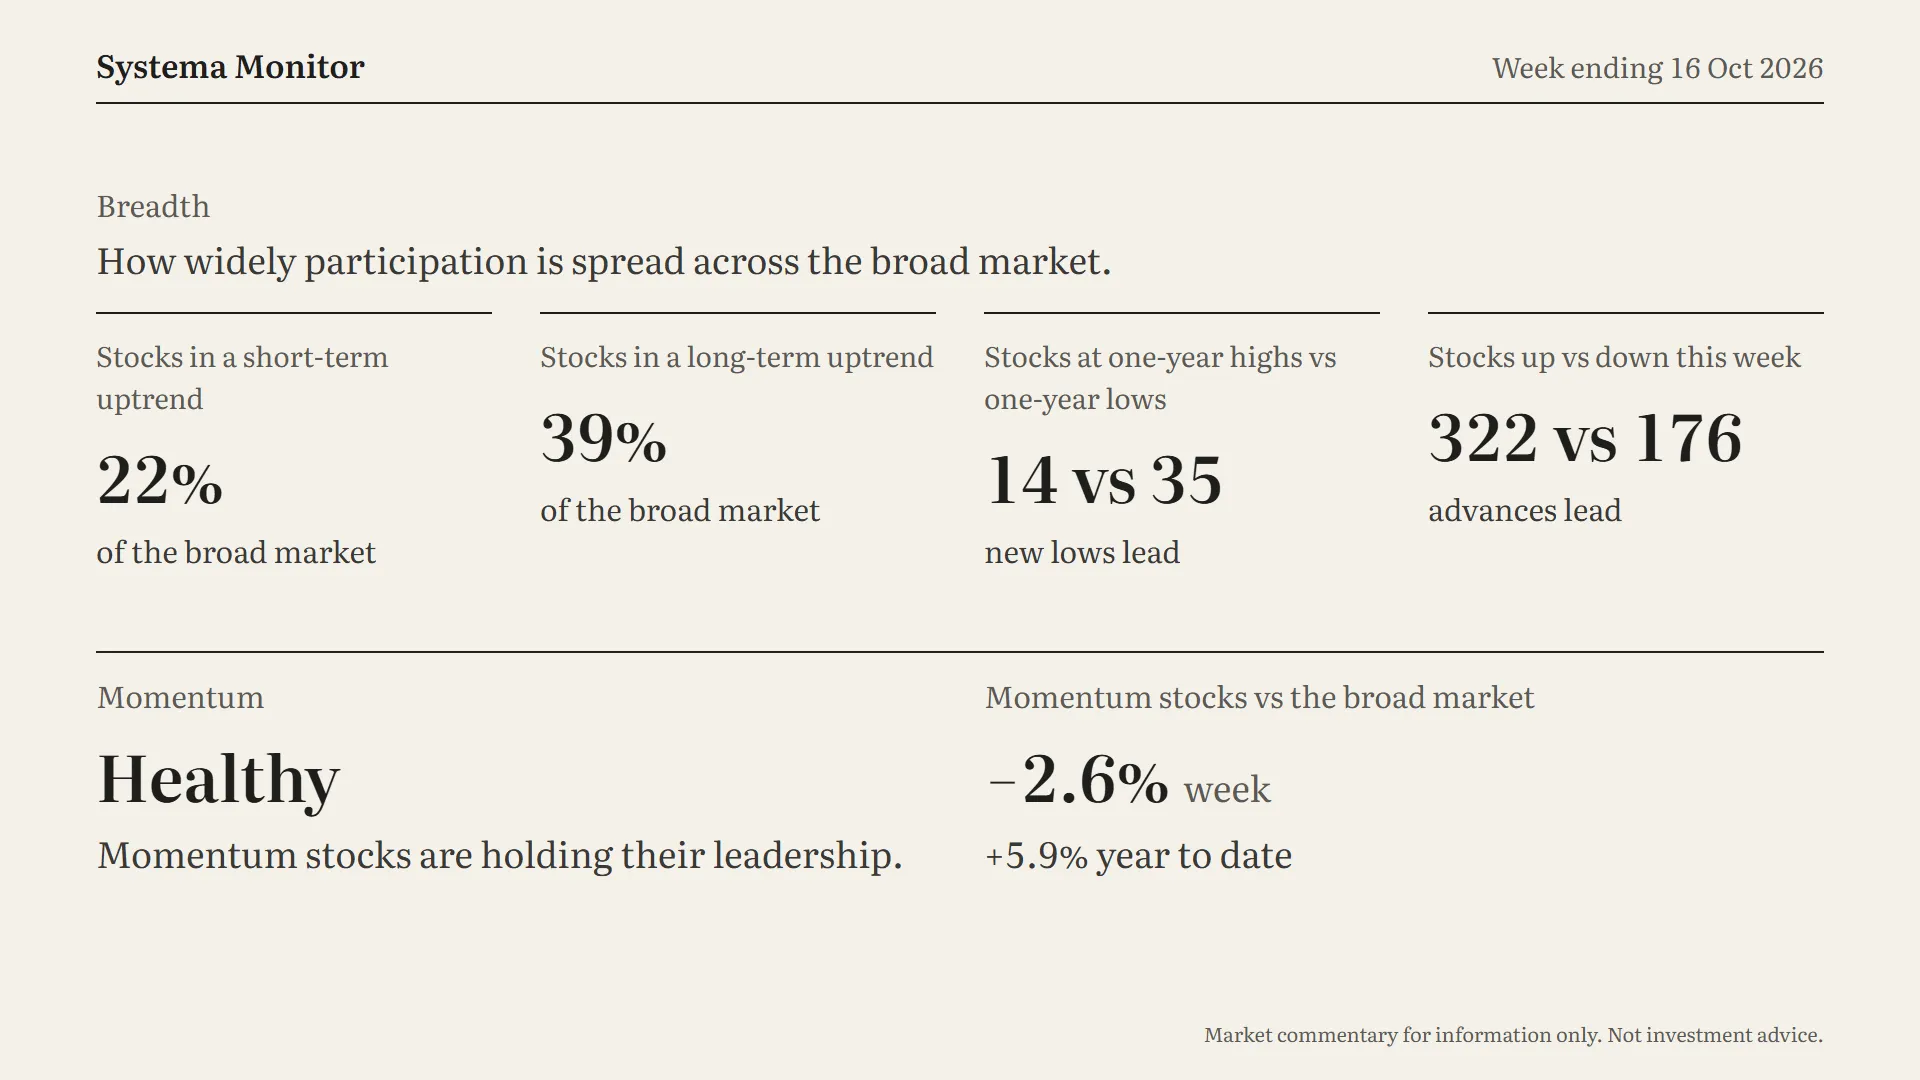
Last week we said a flat index was hiding a lot of falling stocks. This week, breadth moved the right way on every measure.
Stocks up versus down: 322 rose this week, and 176 fell. Last week it was the other way round. This time advances clearly led.
One-year highs versus lows: 14 new highs against 35 new lows. New lows still lead, but last week there were 86 of them. That number has fallen by more than half.
Short-term uptrend: about 22% of the broad market, up from 17%.
Long-term uptrend: 39%, up from 37%.
So participation is improving. It’s still thin: fewer than one in four stocks are in a short-term uptrend. But this time the bounce wasn’t just a handful of large names.
Now momentum, and here’s the other side of the story. Momentum stocks are still Healthy: they’re holding their leadership. But this week they trailed the broad market, by about 2.6%. Their lead for the year has narrowed from about eight and a half percentage points to about six.
That’s what a laggard-led rally usually looks like. When the stocks that have been left behind all year suddenly get bought, this year’s leaders don’t keep pace. One week of that doesn’t change the picture, and the status is still Healthy. It’s the thing to keep an eye on in the coming weeks.
Sector Leadership
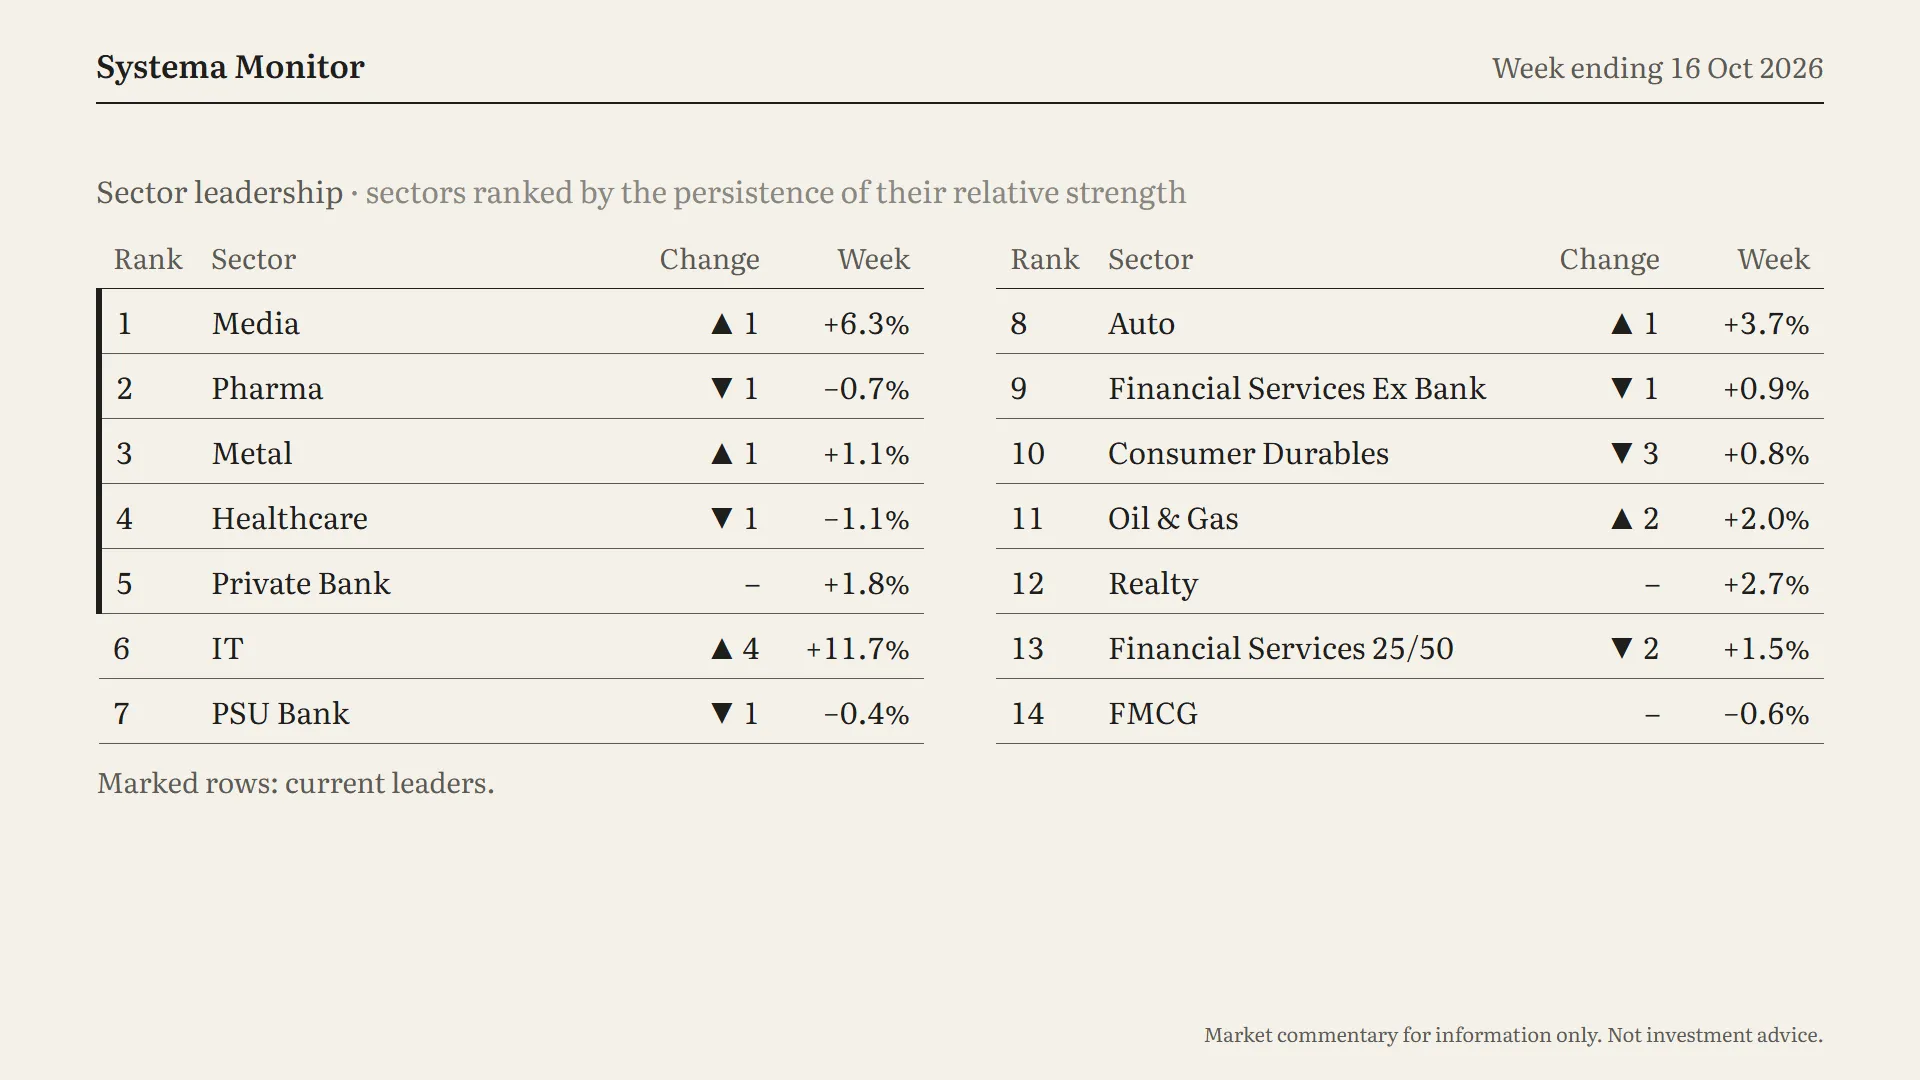
As always, this table ranks sectors by how persistently they’ve been strong, not by one week.
The same five sectors lead for another week, in a slightly different order:
- Media moved up to first, after a strong week, up more than 6%.
- Pharma slipped to second.
- Metal moved up to third.
- Healthcare slipped to fourth.
- Private banks held fifth.
The move of the week was further down. IT rose nearly twelve percent in a single week. That was by far the biggest move on the table, and it lifted the sector four places, from tenth to sixth. IT has been one of the year’s laggards, so it fits the rest of the week’s story.
Elsewhere:
- Auto climbed one place, to eighth, after gaining 3.7%.
- Oil and gas climbed two places, to eleventh.
- Consumer durables had the biggest fall, dropping three places to tenth.
- FMCG stays at fourteenth.
The IT move shows how the table works. A huge week moves a sector up, but it doesn’t put it at the top straight away. To get into the leaders, it has to keep it up.
Week Ahead
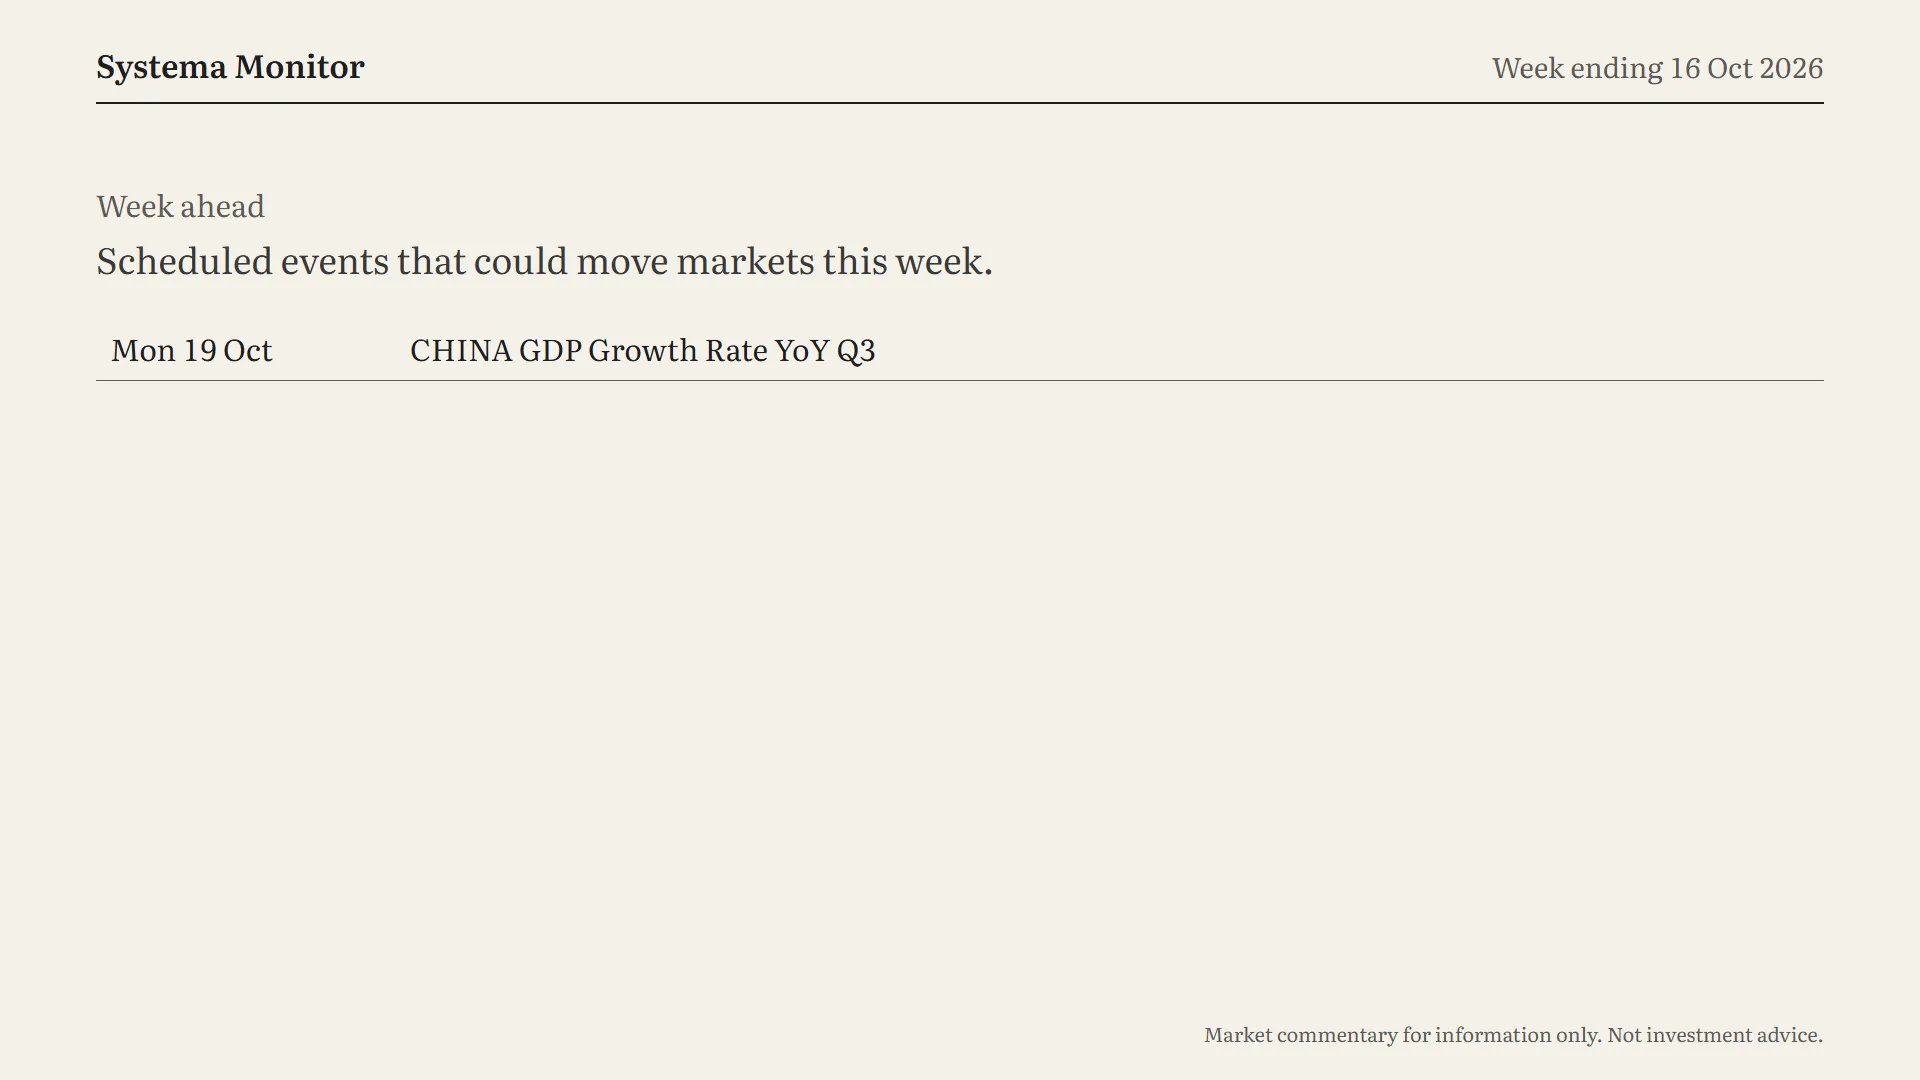
Finally, the week ahead, which is a quiet one.
- Monday, 19 October: China’s third-quarter GDP growth.
With metals in the leaders’ group and crude moving sharply this week, the Chinese growth number is worth watching.
To sum up: the market bounced, and this time the bounce was broad, with more stocks rising than falling and far fewer new lows. The largest companies and the year’s laggards led, with IT the standout. The rupee firmed, crude jumped, and yields rose for a third week. The regime is still Quiet Downtrend, six weeks running, but the market is closer to its trend. Momentum stocks are still Healthy, though they gave back some of their lead this week.
That’s Systema Monitor for this week. Thanks for reading and see you next week.
For trade breakdowns of what I traded during the week, kindly watch this.

Referral link. *T&Cs apply. Investment in securities market are subject to market risks, read all the related documents carefully before investing. For a detailed disclaimer visit https://zerodha.com/pricing. Member ID NSE (13906), BSE (6498), MCX (46025). Brokerage will not exceed the SEBI prescribed limit.
Get new lessons by email
One email when a new article is published, free. Unsubscribe any time. We only use your email to send the newsletter; see the privacy policy.