Systema Monitor (Week 41)
Week ending 9 October: the Nifty 500 ended flat, but most stocks fell, foreign investors kept selling, and the Quiet Downtrend reached five weeks.
Market data in this review is as of 9 October 2026.
 Watch the video: Systema Monitor (Week 41)
This is market commentary for information only. It’s not investment advice.
Market Regime
Hello, and welcome to Systema Monitor for the week ending the ninth of October.
Last week the market fell more than three percent. This week the Nifty 500 ended almost exactly where it started. That sounds like calm. As we’ll see, it wasn’t quite that.
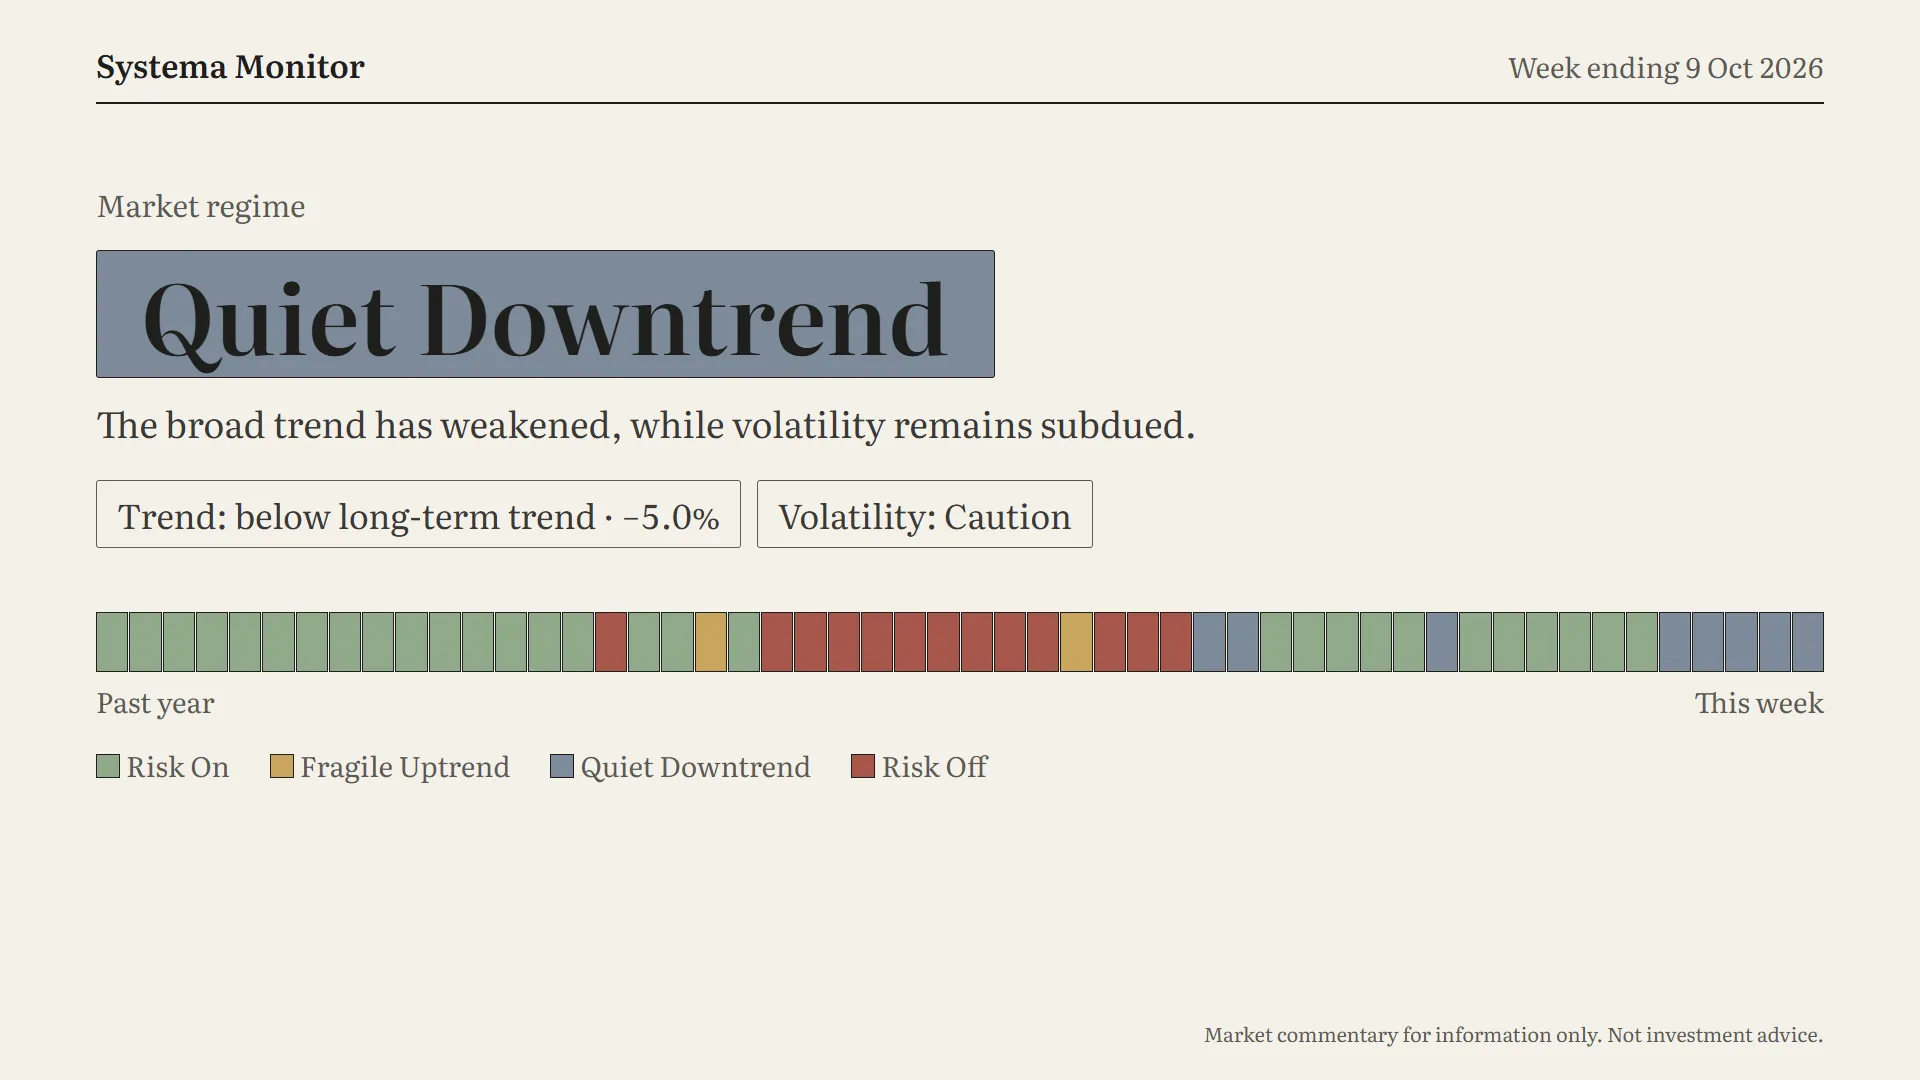
We start, as always, with the market regime. It’s still Quiet Downtrend. The broad trend has weakened, but volatility hasn’t spiked.
This is the fifth week in a row in this regime. Look at the strip across the bottom: one block per week for the past year. Earlier in the year, Quiet Downtrend showed up for a week or two at a time and then gave way. This is its longest run of the past twelve months.
Two readings sit behind the label. Trend: the broad market is still below its long-term trend, by just under five percent. That gap barely changed this week. Volatility reads Caution. That means it’s higher than usual compared with its own recent history, but nowhere near panic.
So the trend is down, the mood is wary, and nobody’s panicking. That’s this regime.
Scoreboard
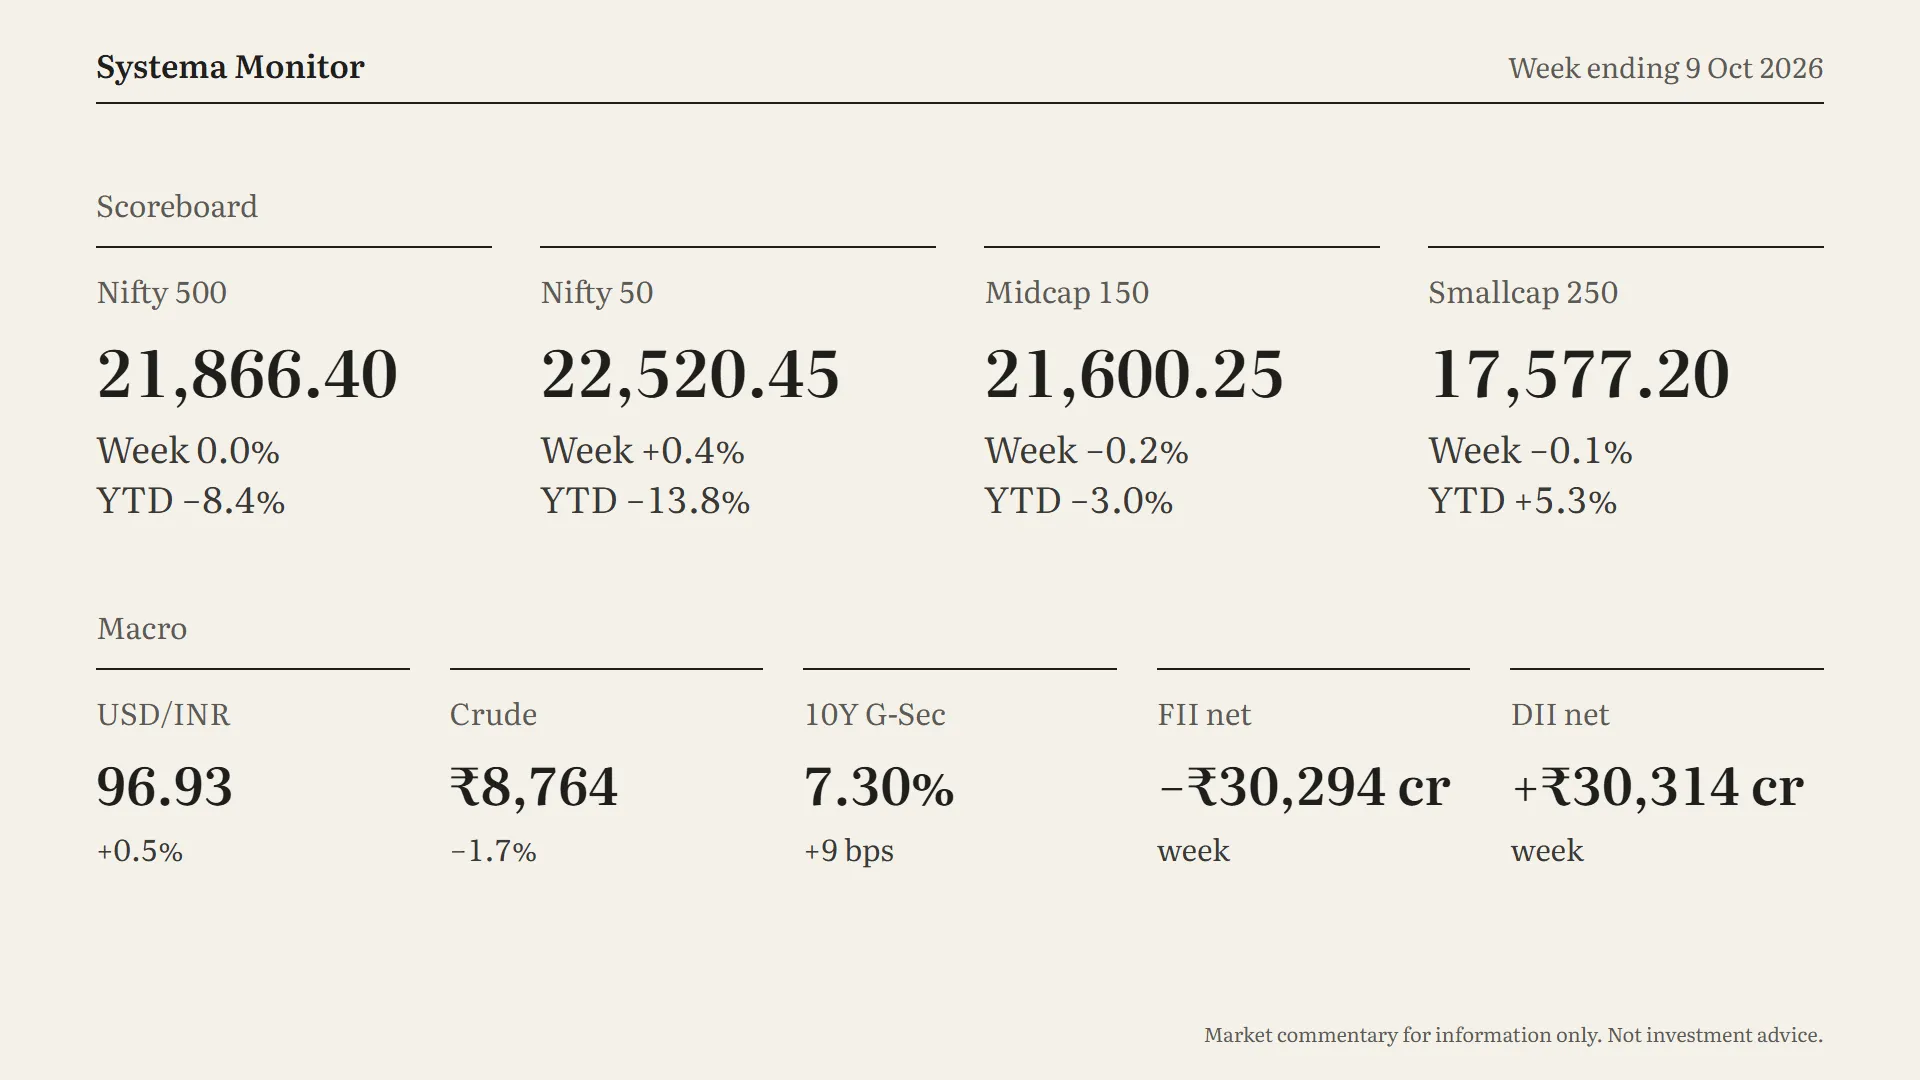
Now the scoreboard. The Nifty 500 closed at 21,866, flat on the week. It’s down about eight and a half percent for the year.
The Nifty 50 did a little better, up about 0.4%, at 22,520. But it’s still the weakest index this year, down nearly fourteen percent.
Midcaps slipped 0.2%, and smallcaps slipped 0.1%.
This year’s split by company size is worth a moment. Smallcaps are up more than five percent this year, while the Nifty 50 is down almost fourteen. That’s a gap of nearly nineteen percentage points between the smallest and largest companies.
On to macro. The rupee weakened again. USD/INR rose half a percent to about 96.9.
Crude eased 1.7%, a small help for an oil importer like India.
The 10-year government bond yield rose nine basis points to 7.30%. It also rose about nine basis points last week, so yields are up nearly twenty basis points in two weeks.
And then flows, the biggest story of the week. Foreign investors sold a net thirty thousand two hundred crore rupees of Indian equities. Domestic institutions bought a net thirty thousand three hundred crore, so the two cancelled out almost to the rupee. The heaviest day was Thursday, when foreign selling came close to thirteen thousand crore in a single session.
Put this week together with last week, and foreign investors have sold roughly sixty-five thousand crore in two weeks. Domestic money has absorbed nearly all of it. That’s a big reason the index held flat.
Breadth & Momentum
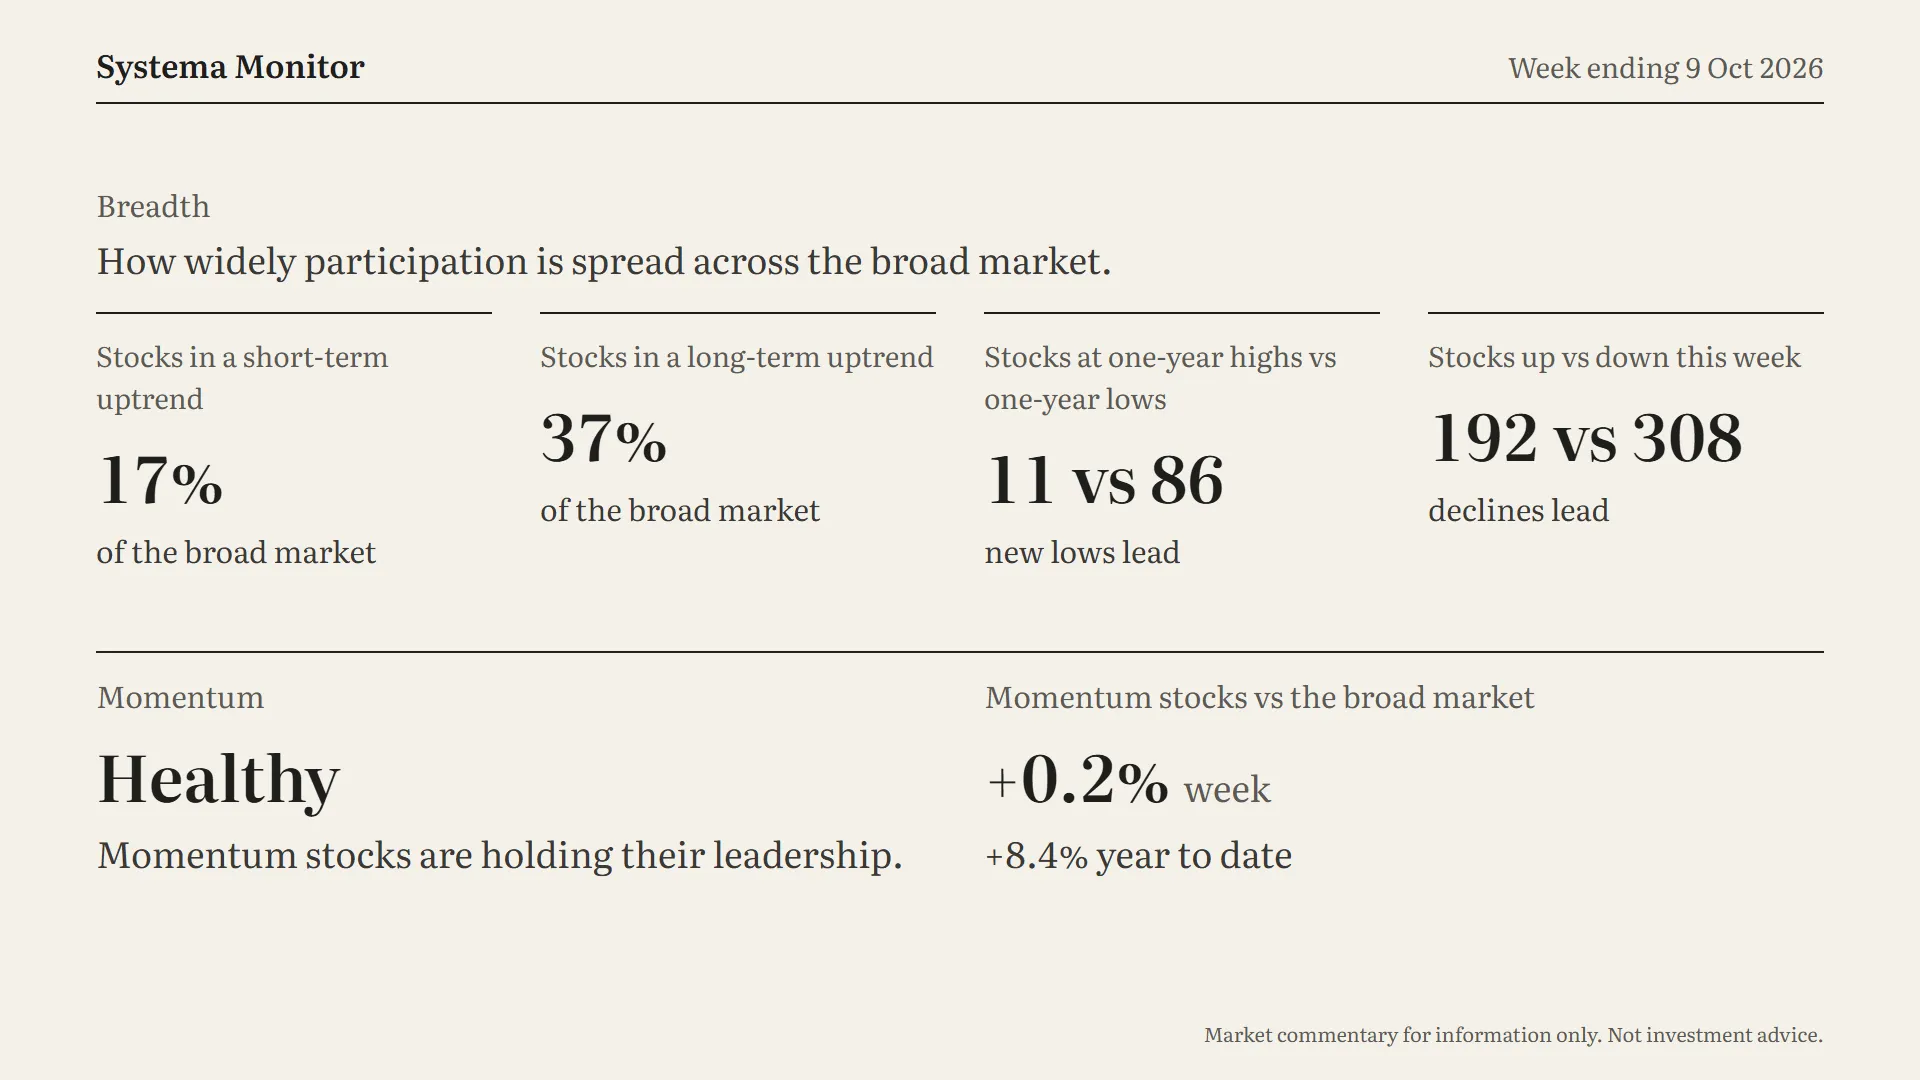
But a flat index doesn’t mean a flat market. Breadth shows us what happened underneath.
Stocks up versus down: 192 rose this week and 308 fell. That’s better than last week, when only 54 rose, but declines still clearly led. So the index held flat while most stocks fell. The large heavyweights carried the average, and the typical stock did worse than the headline.
One-year highs versus lows: 11 new highs against 86 new lows. New lows are still far ahead.
Short-term uptrend: only about 17% of the broad market. That’s barely changed from last week.
Long-term uptrend: 37%, unchanged.
In short, participation is still thin. A few large names are holding the index up, and most of the market isn’t joining in yet.
Now momentum, and this part is steadier. Momentum stocks are Healthy, meaning they’re holding their leadership. They edged ahead of the broad market by about 0.2% this week. For the year, they’re ahead by roughly eight and a half percentage points. So even in a falling market, the leaders have kept leading.
Sector Leadership
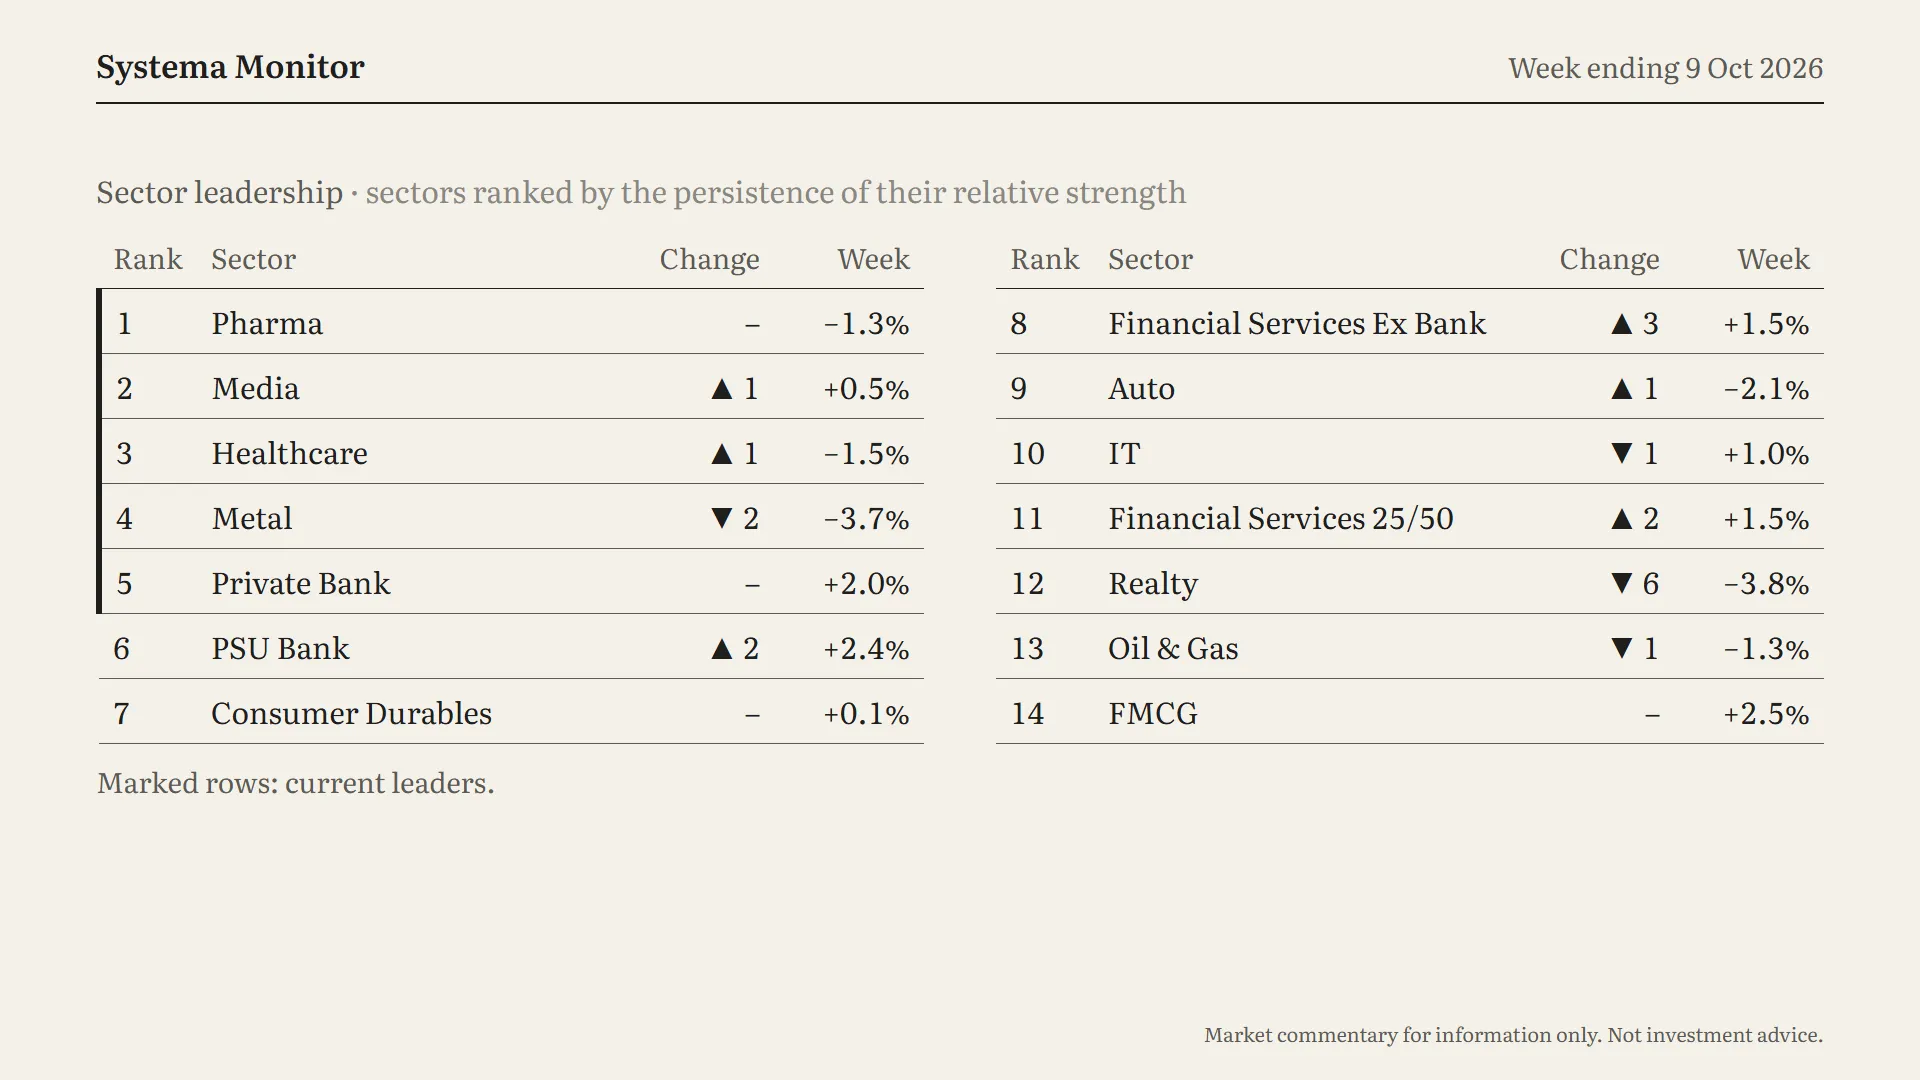
Remember, this table ranks sectors by how persistently they’ve been strong. One good week doesn’t change it much.
The leaders are the same five as last week, slightly reshuffled:
- Pharma is still number one.
- Media moved up to second.
- Healthcare moved up to third.
- Metal slipped two places, to fourth, after a weak week, down 3.7%.
- Private banks held fifth and gained 2% this week.
Pharma and healthcare, two defensive sectors, are both in the top three. That fits a market that has been playing it safe.
Further down the table:
- Realty had the biggest move. It dropped six places, to twelfth, after falling almost 4% this week.
- PSU banks climbed two places, to sixth.
- Financial services outside banks climbed three, to eighth.
The ranking rewards persistence, and FMCG shows why. It was the best-performing sector this week, up 2.5%, but it’s still ranked fourteenth. One good week doesn’t erase a long stretch of lagging.
Week Ahead
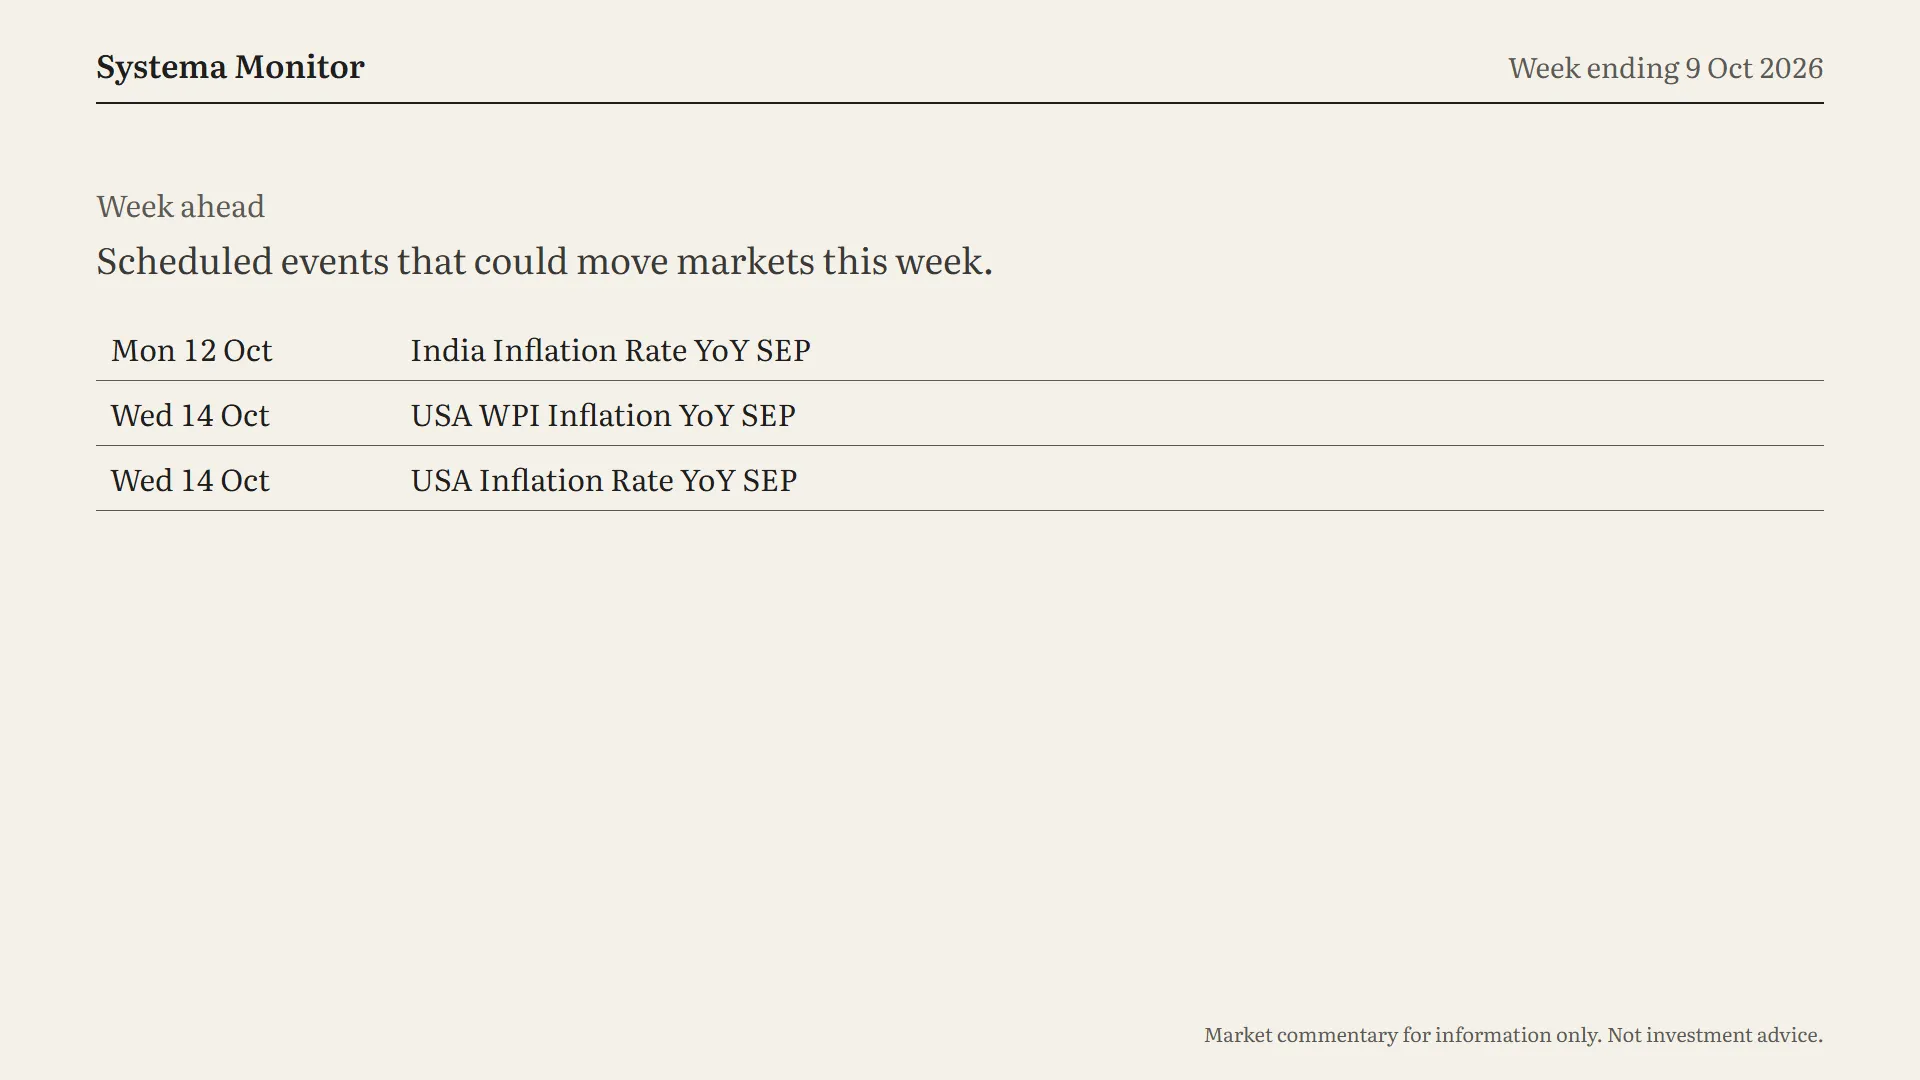
Finally, the week ahead. It’s all about inflation.
- Monday, 12 October: India’s consumer inflation for September.
- Wednesday, 14 October: US consumer inflation for September, and US producer prices on the same day.
With bond yields up two weeks in a row, the rupee soft and foreign investors selling, inflation numbers at home and in the US both matters.
To sum up: the headline looked calm, but most stocks still fell, foreign investors kept selling, and domestic money took the other side. The regime is still Quiet Downtrend, now five weeks running, while momentum stocks hold their leadership.
That’s Systema Monitor for this week. Thanks for reading and see you next week.
For trade breakdowns of what I traded during the week, kindly watch this.

Referral link. *T&Cs apply. Investment in securities market are subject to market risks, read all the related documents carefully before investing. For a detailed disclaimer visit https://zerodha.com/pricing. Member ID NSE (13906), BSE (6498), MCX (46025). Brokerage will not exceed the SEBI prescribed limit.
Get new lessons by email
One email when a new article is published, free. Unsubscribe any time. We only use your email to send the newsletter; see the privacy policy.