Systema Ledger | September 2026 Portfolio Report
September 2026, quarter-end edition: the account fell 4.2% against the Nifty 500's 5.9%, as the hedge and options income cushioned the fall.
Market data in this review is as of 30 September 2026.
Welcome to Systema Ledger, my monthly report on how my own account is doing. This is the September 2026 edition, and because September ends a quarter, it’s the longer quarter-end edition.
Everything here is in percentages. I won’t show amounts, and I won’t name any stocks. I’ll explain why a little later.
One thing before we start: this is my account’s performance, shared for information only. It’s not investment advice, and past results don’t predict future ones.
A quick note on how to read the numbers. When I add or withdraw money, that isn’t counted as a gain or a loss. Every figure shows how the investments themselves did, so it’s a fair comparison with the market.
The account has a few parts. The main one is the momentum stocks, a portfolio run by fixed rules since 13 July. Alongside it there’s a hedge that protects those stocks, an options income part, a few holdings from before the system started, and general account costs. You’ll see each of them in the frames.
Account vs Nifty 500
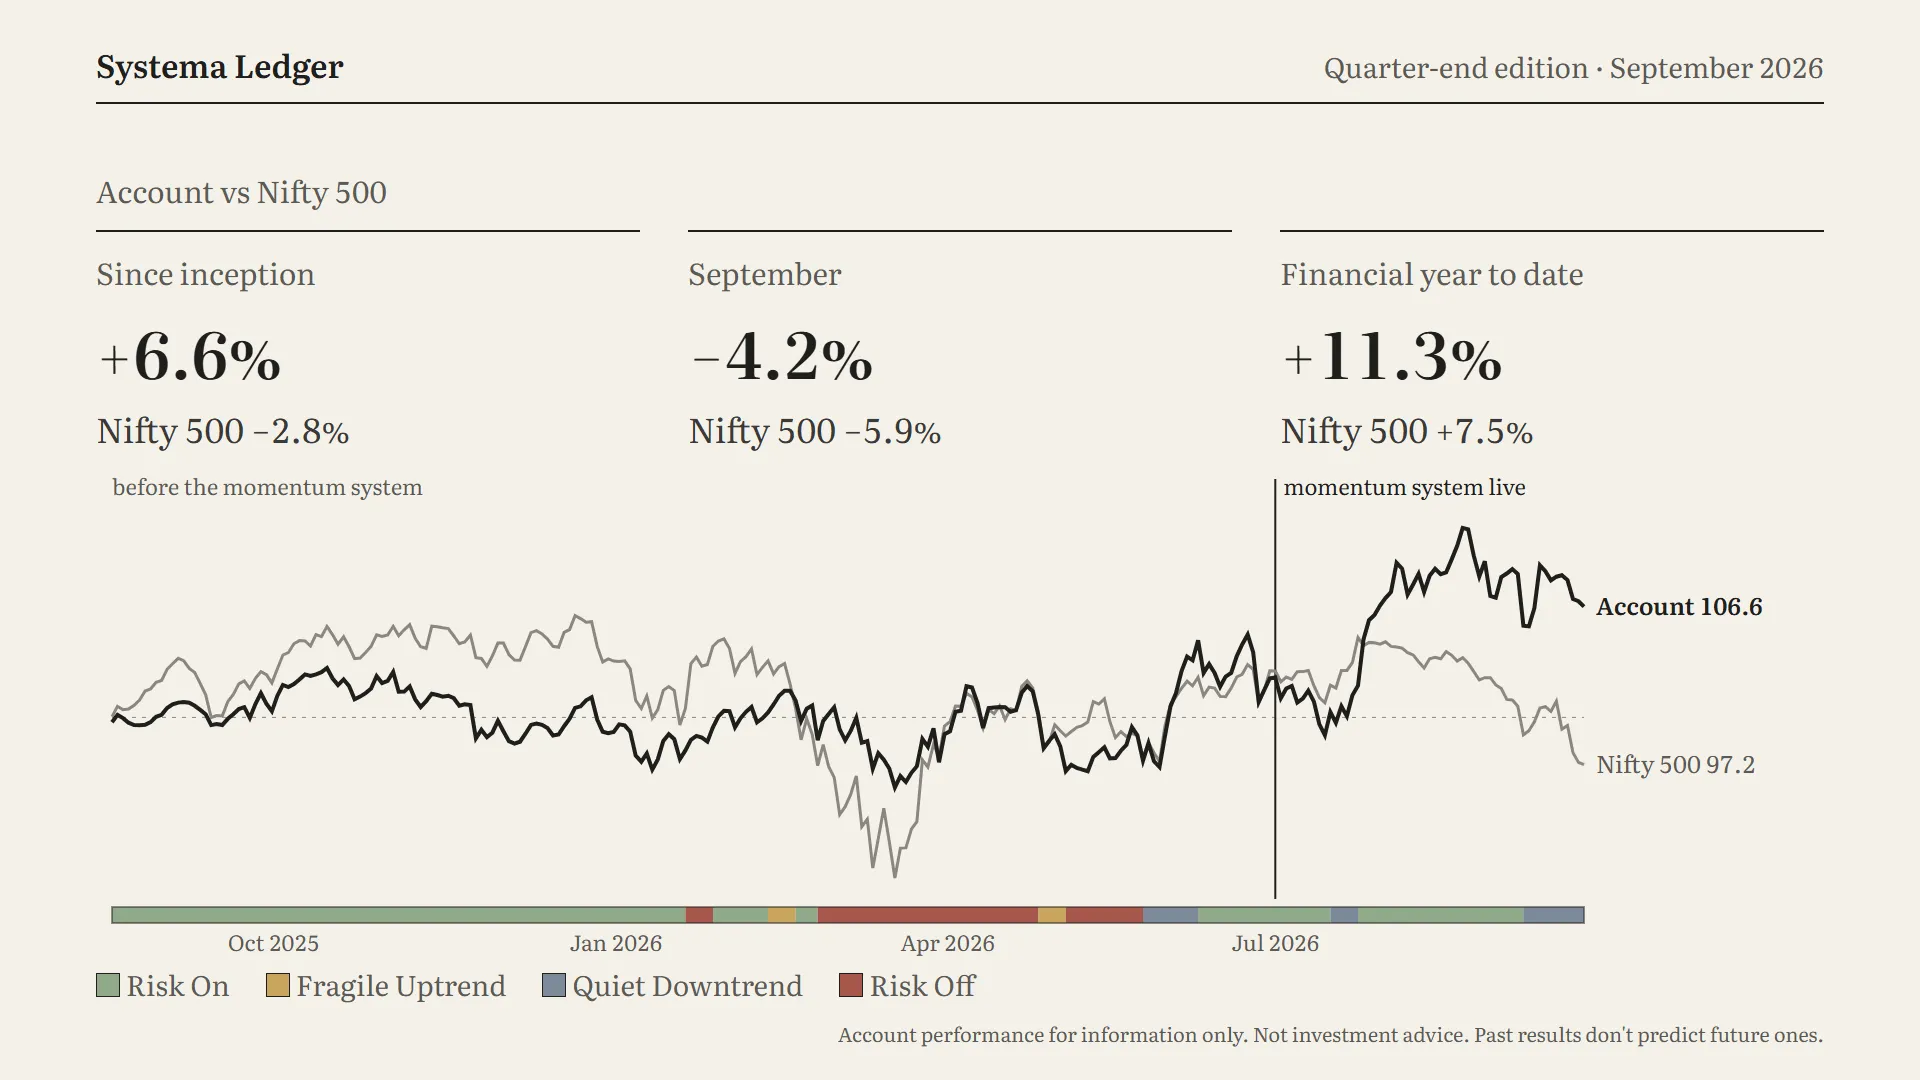
Let’s start with the big picture: the whole account against the Nifty 500, which is the broad Indian market.
Since I started in September last year, the account is up 6.6%. Over the same time, the Nifty 500 is down 2.8%.
September itself was a bad month for everyone. The account fell 4.2%, but the market fell more, 5.9%. So we lost less than the market.
For the financial year so far, since April, the account is up 11.3%, against 7.5% for the market.
In the chart, both lines start at 100, so a reading of 106.6 means the account is up 6.6%. The dark line is the account; the grey line is the market.
The vertical line marks 13 July, the day the momentum system went live. Everything to the left of it is the account before the system.
The coloured strip along the bottom is the market’s mood each week, from my weekly Systema Monitor report. Green is Risk On, yellow is a fragile uptrend, blue-grey is a quiet downtrend, and red is Risk Off.
One more number worth knowing: the deepest fall from a high point so far was 7%, and right now the account is 4.2% below its peak.
Where the return came from
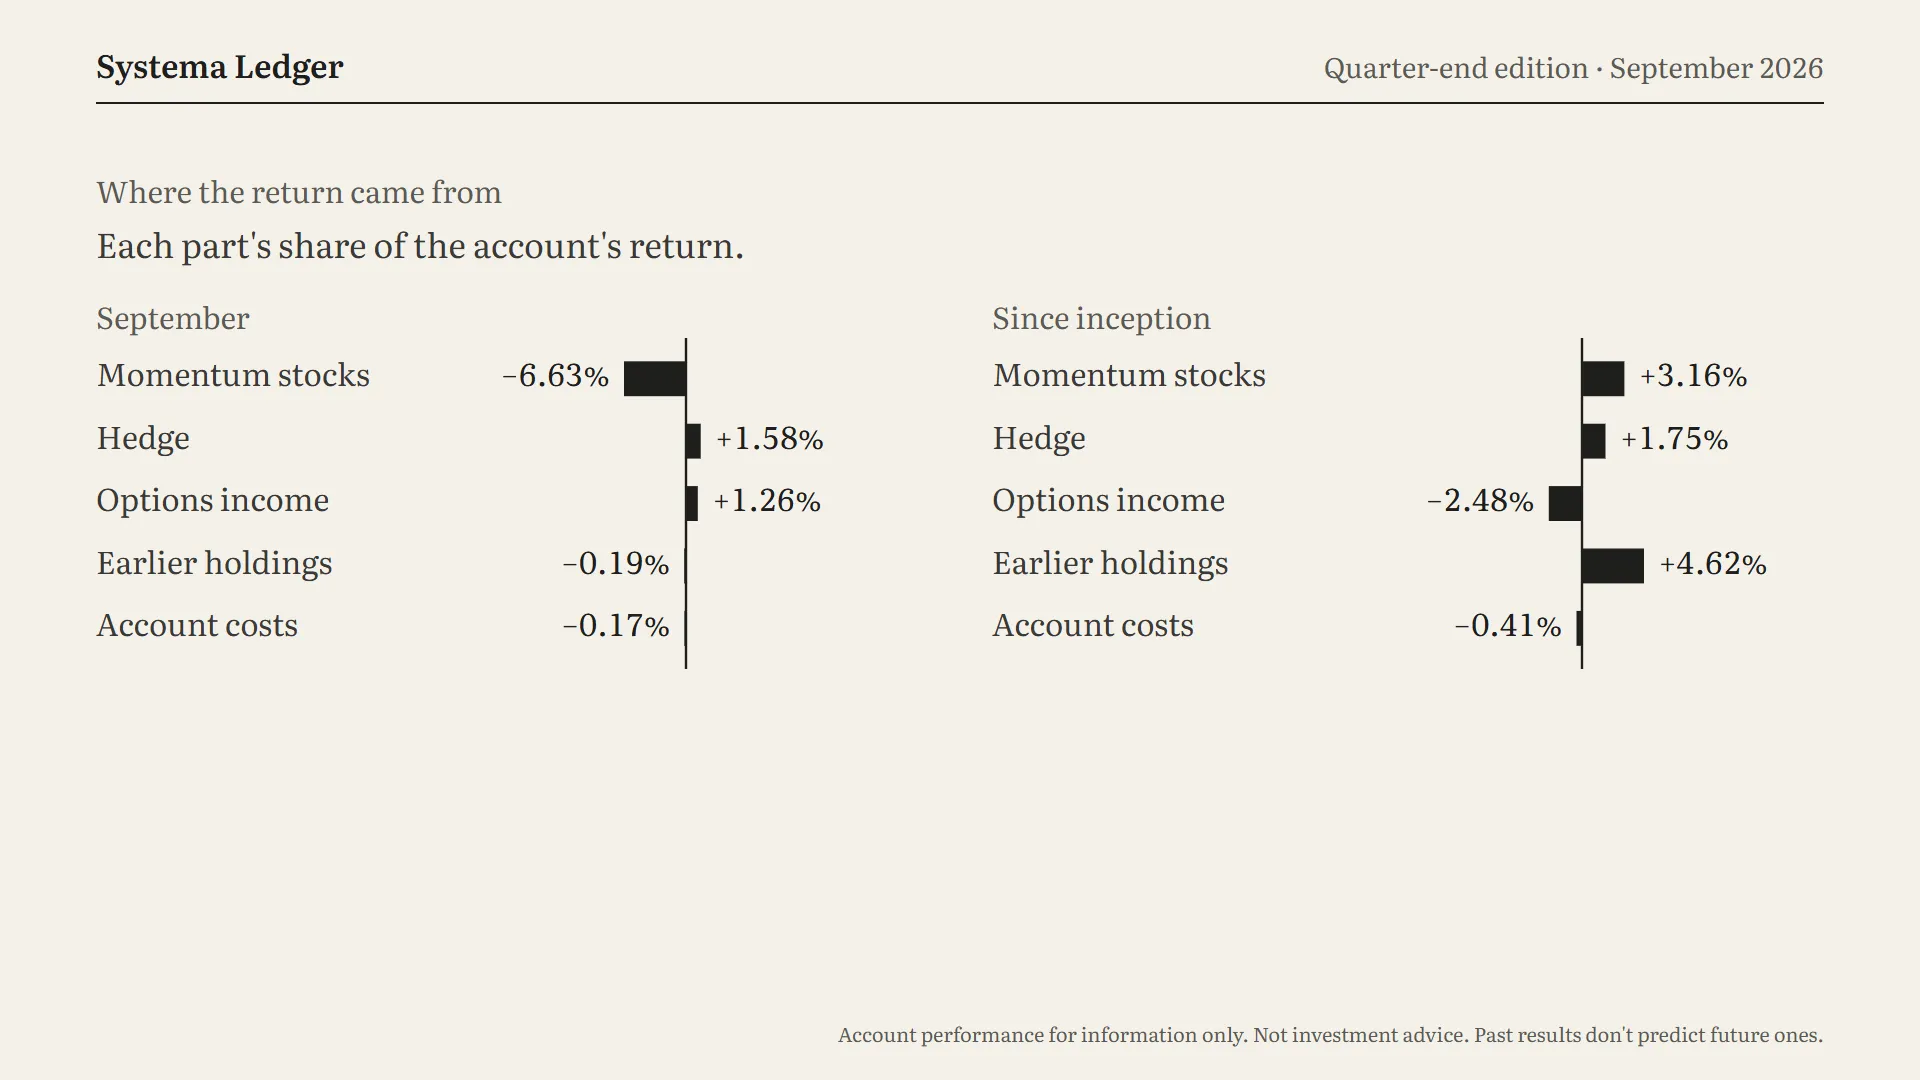
This frame breaks the account’s return into its parts. Each bar is how much that part added or took away. Add the bars up and you get the account’s total.
In September, the momentum stocks took 6.6% off the account. That’s simply the market falling. But the hedge gave back 1.6%, and options income added another 1.3%. That’s why the account lost 4.2% instead of 6.6%. The protection did its job.
The earlier holdings and the account costs were small, each about 0.2% down.
Since the start, the earlier holdings have contributed the most, 4.6%. The momentum stocks have added 3.2%, and the hedge 1.8%.
I’ll be honest about options income: despite a good September, it’s down 2.5% over the whole period. I’ll keep reporting it either way.
Momentum book
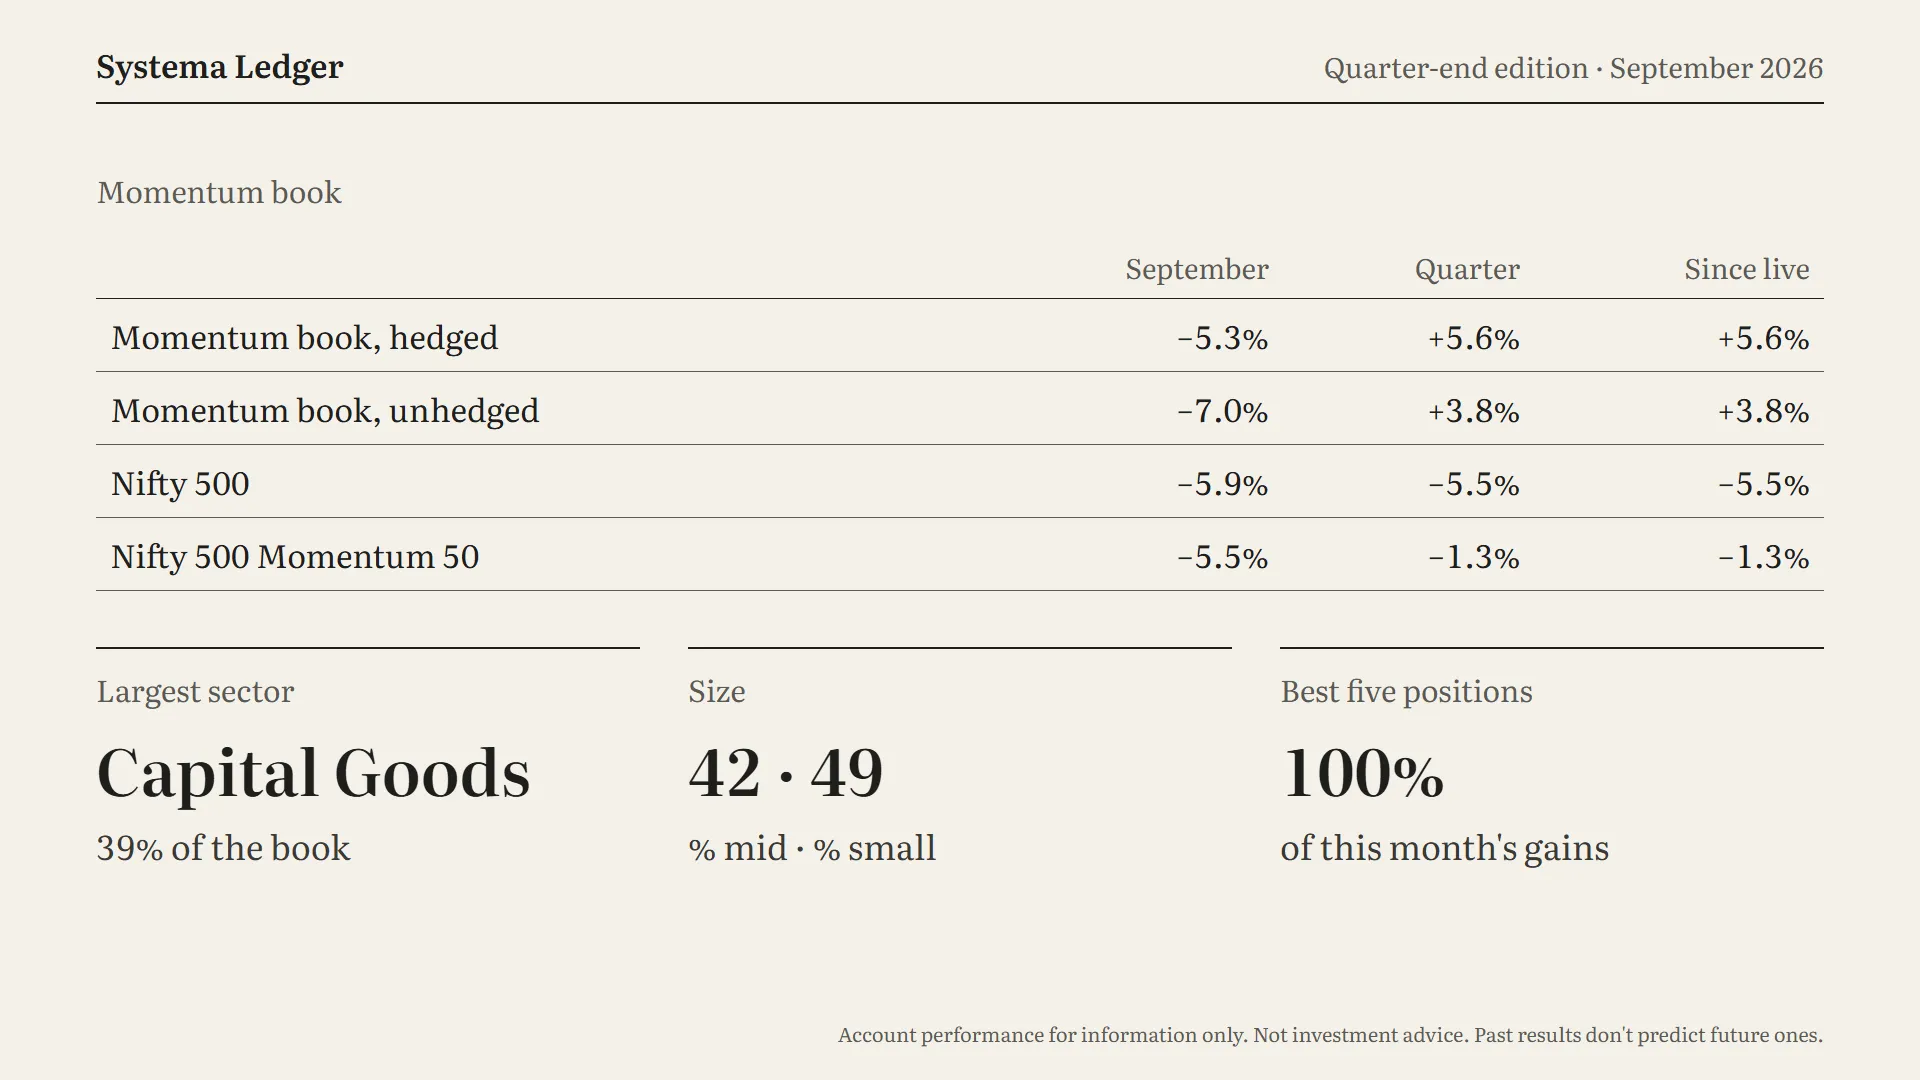
Now just the momentum stocks on their own, compared with three yardsticks. The Nifty 500 is the broad market. The Nifty 500 Momentum 50 is an index that also picks strong stocks, so it’s the fairest comparison for a strategy like mine.
Since going live on 13 July, the stock book is up 5.6% including the hedge, and 3.8% without it. Over the same time, the Nifty 500 fell 5.5% and the Momentum 50 index fell 1.3%.
In September alone, the stocks fell 7% before the hedge, a little more than the market’s 5.9%. With the hedge, the fall was 5.3%.
The largest sector in the book is capital goods, at 39%. By size, 42% is in mid-sized companies and 49% in small ones; the rest is in companies that have since moved out of both groups.
The last tile says the best five positions made 100% of this month’s gains. In a falling month, only a handful of stocks made money at all, so all the gains came from those five.
What the system did · rule scorecard
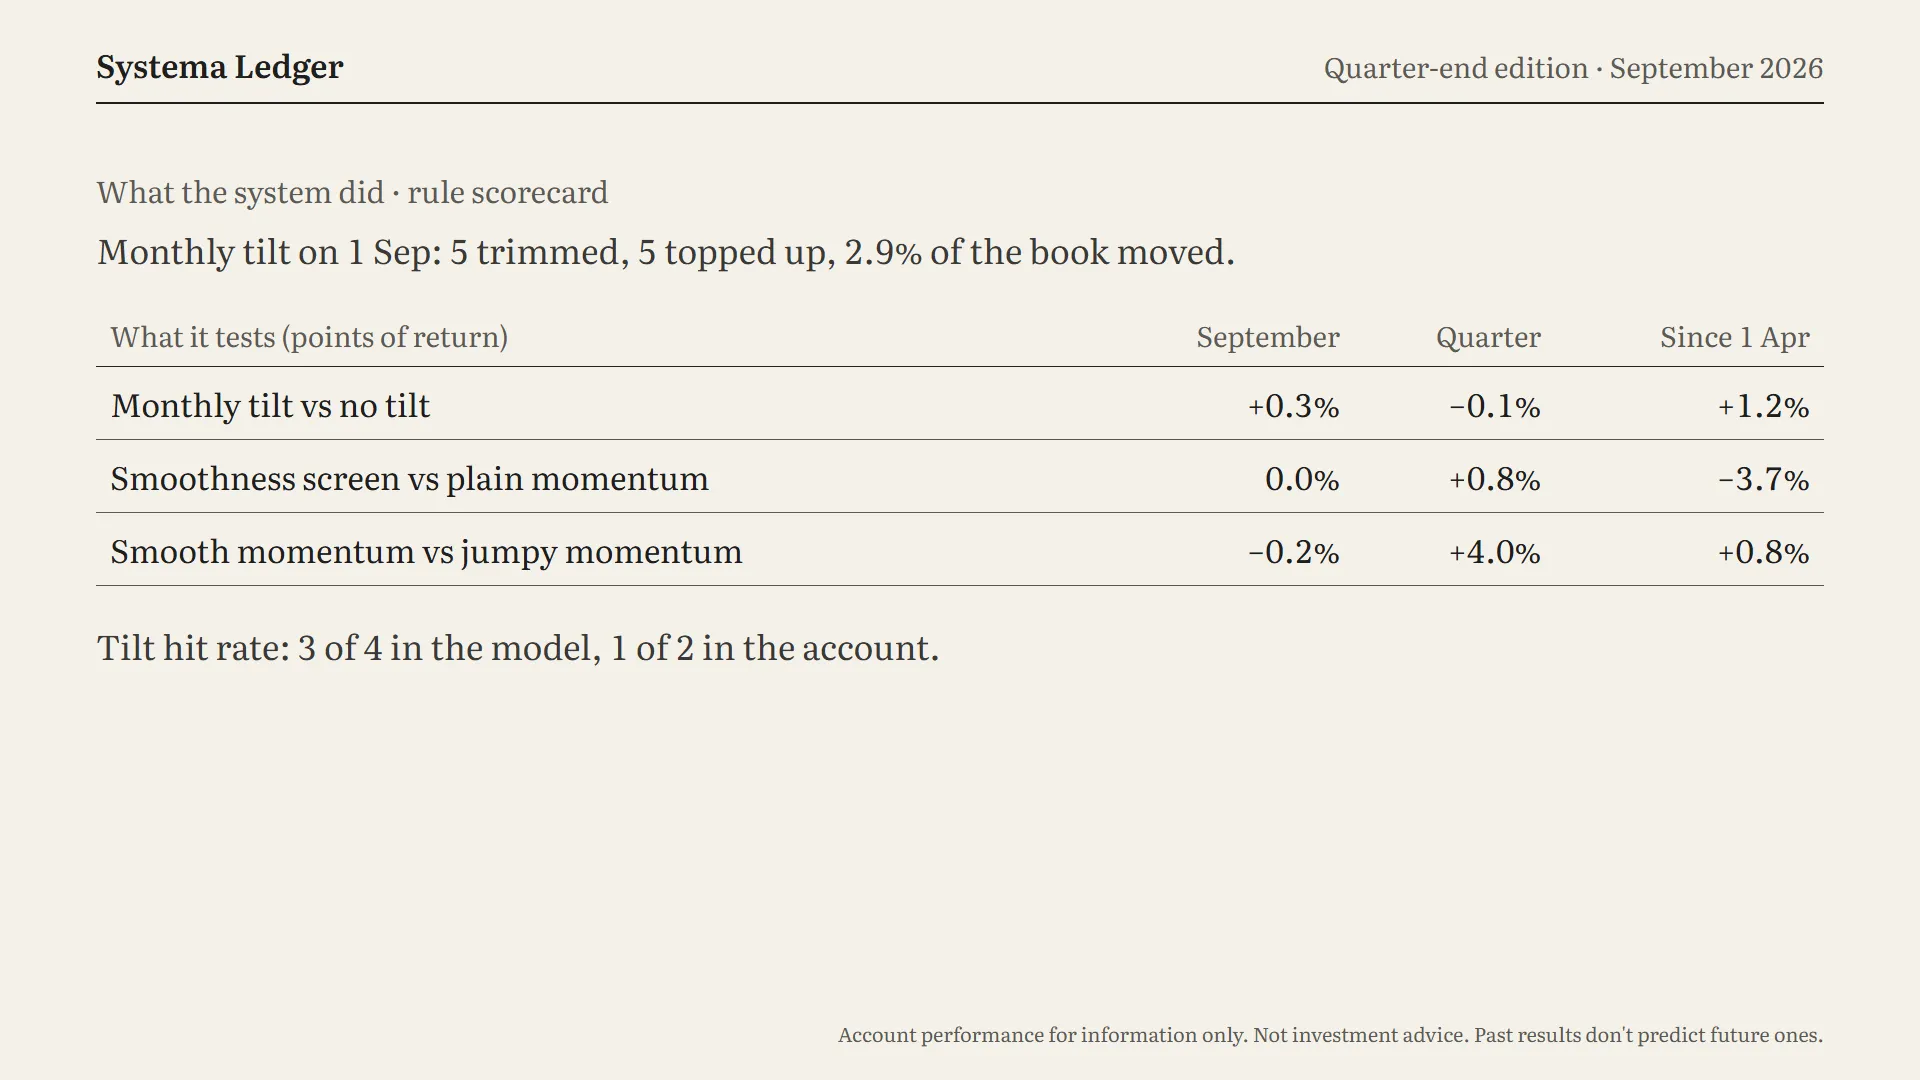
Every month, on the first trading day, the system does a monthly tilt. On 1 September it cut back the 5 weakest positions and added to the 5 strongest. About 2.9% of the book changed hands.
The rule scorecard is how I keep myself honest. Each rule is tested by running the same portfolio without it, with the same data, the same start and the same costs, and seeing which did better. These are model portfolios, tracked since 1 April.
First row: the monthly tilt. It added 0.3% in September and 1.2% since April. Over the quarter it was roughly flat, at minus 0.1%.
Second row: the smoothness screen. The system prefers stocks that rose steadily over stocks that simply rose the most. That helped this quarter, by 0.8%, but it’s still 3.7% behind plain momentum since April. I’m showing it either way.
Third row: steady risers against the jumpy ones the screen turned away. This quarter the steady ones won by 4%.
The tilt hit rate asks a simple question: did the stocks we added to beat the stocks we cut, by the end of the month? In the model, yes, 3 times out of 4. In the real account, 1 time out of 2.
Hedge · options income · costs
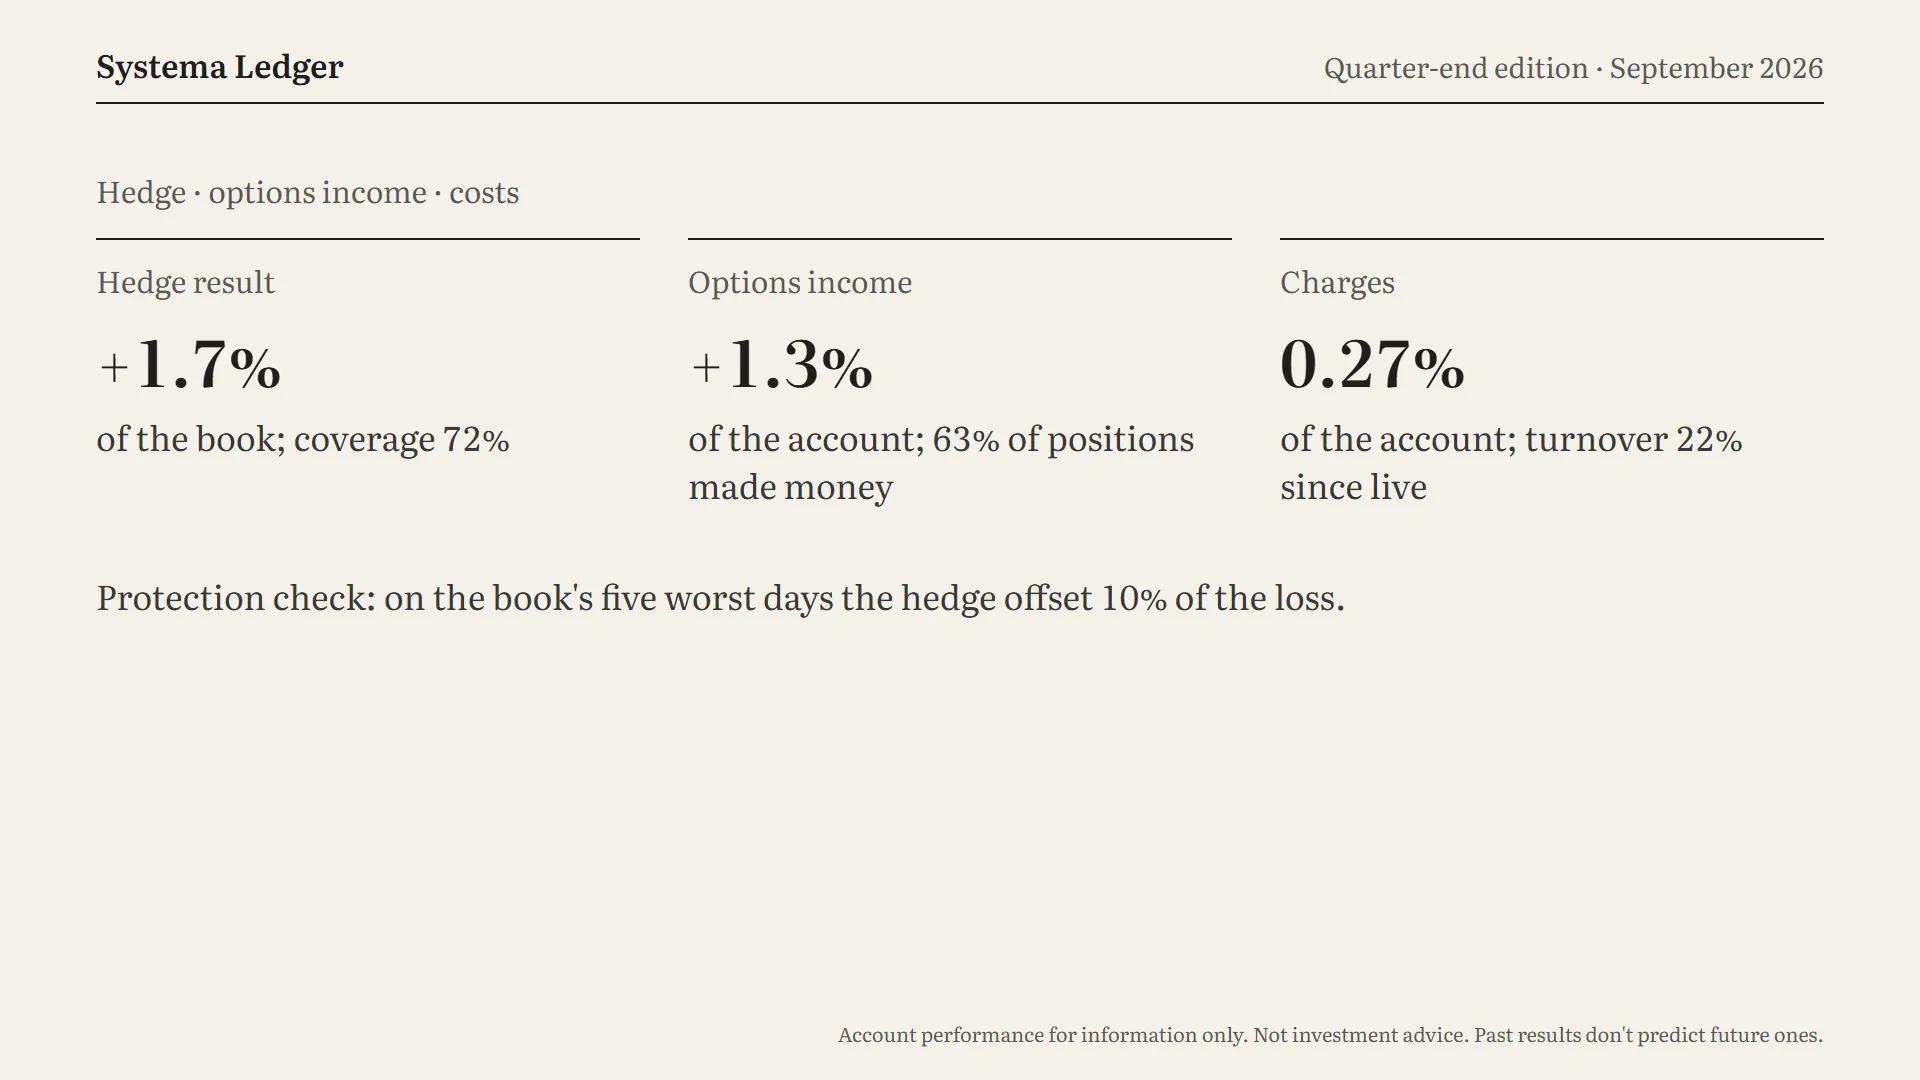
Three quick numbers here.
First, the hedge. This is protection I buy to cushion the stock book when markets fall. In September it earned 1.7% of the stock book’s value. At the end of the month, about 72% of the book was protected.
Second, options income. In September it added 1.3% to the account. Counting every options position I’ve closed since the start, 63% made money.
Third, costs. All charges this month came to 0.27% of the account. And since going live, I’ve traded about 22% of the stock book, not counting the first purchases.
The protection check tests whether the hedge works when it matters. On the stock book’s five worst days in September, the hedge made back 10% of what the stocks lost. Not everything, but it softened the blow.
Notes
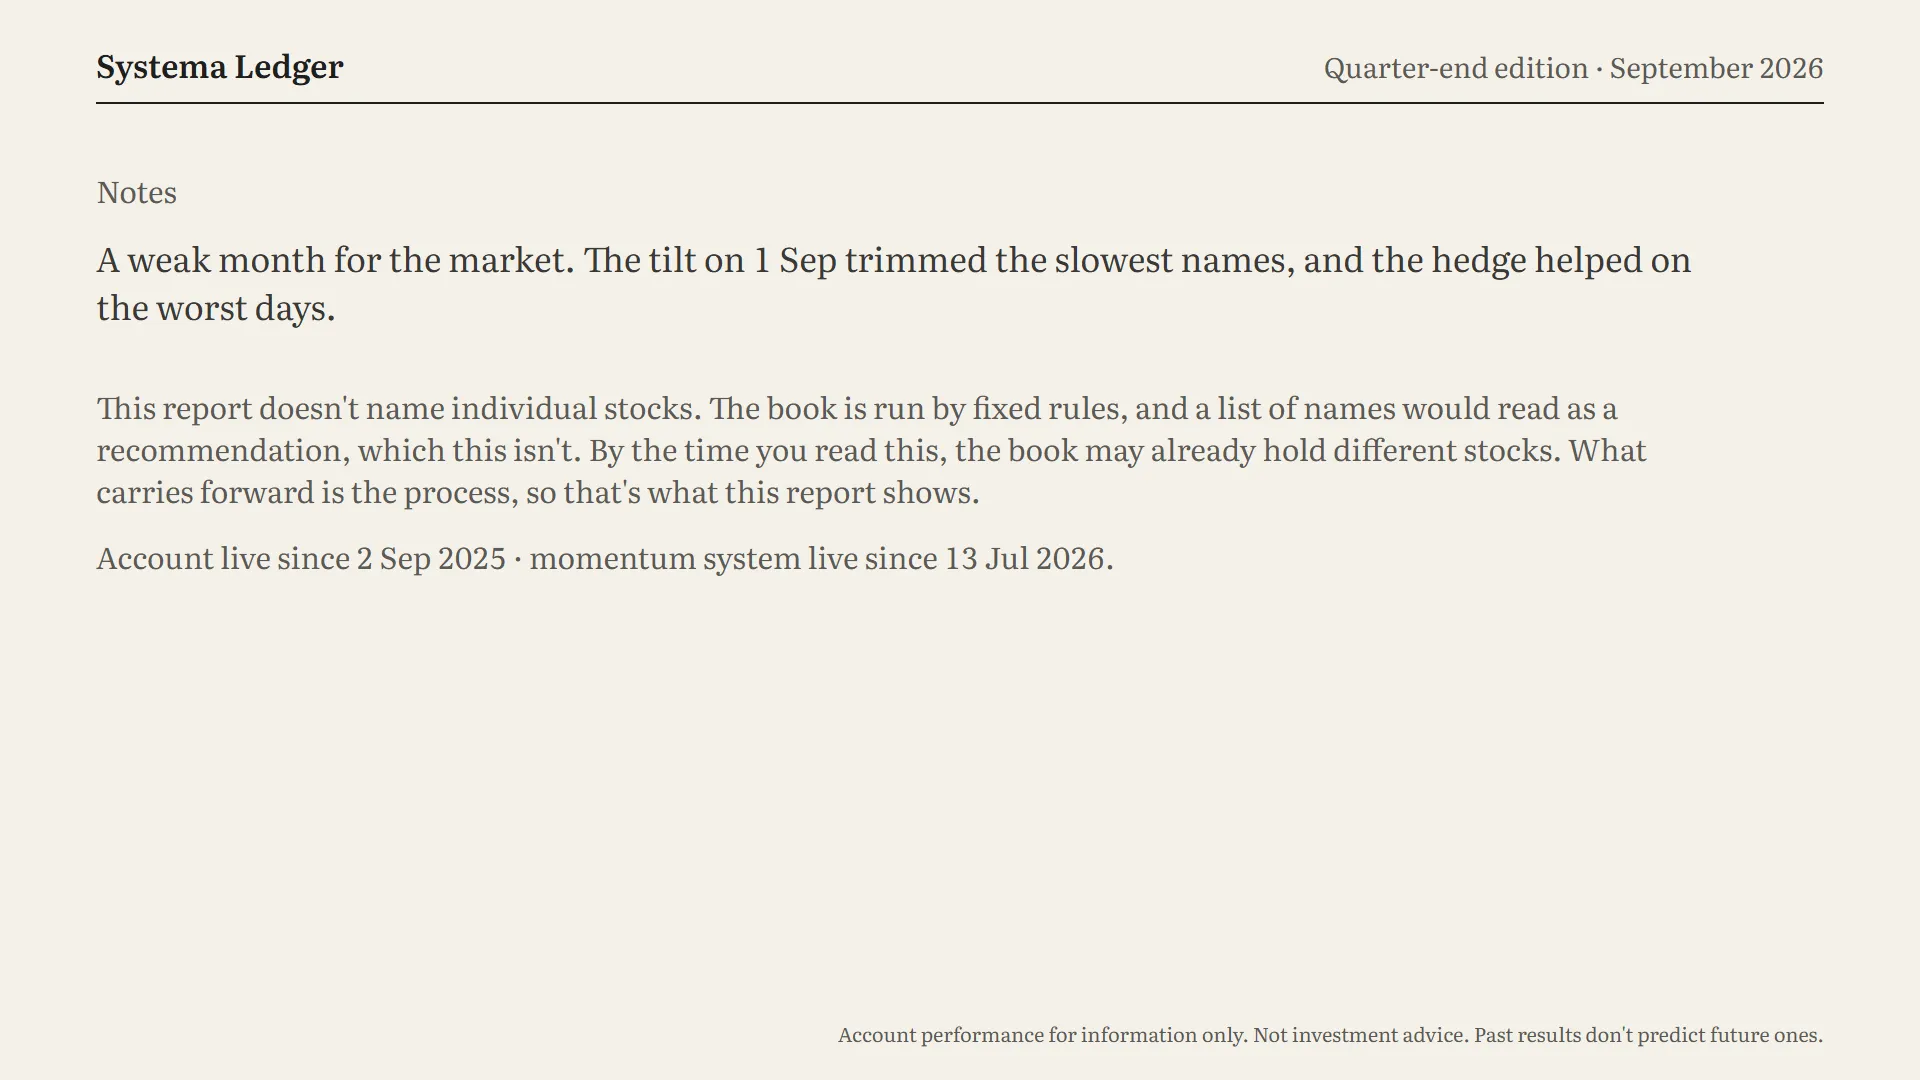
You may have noticed I never name any stocks. That’s deliberate. The book is run by fixed rules, and a list of names would sound like a recommendation, which this isn’t. By the time you watch this, the book may already hold different stocks. What carries forward is the process, so that’s what I show you.
The account has been live since 2 September 2025, and the momentum system since 13 July 2026.
Quarterly reselection · implementation gap
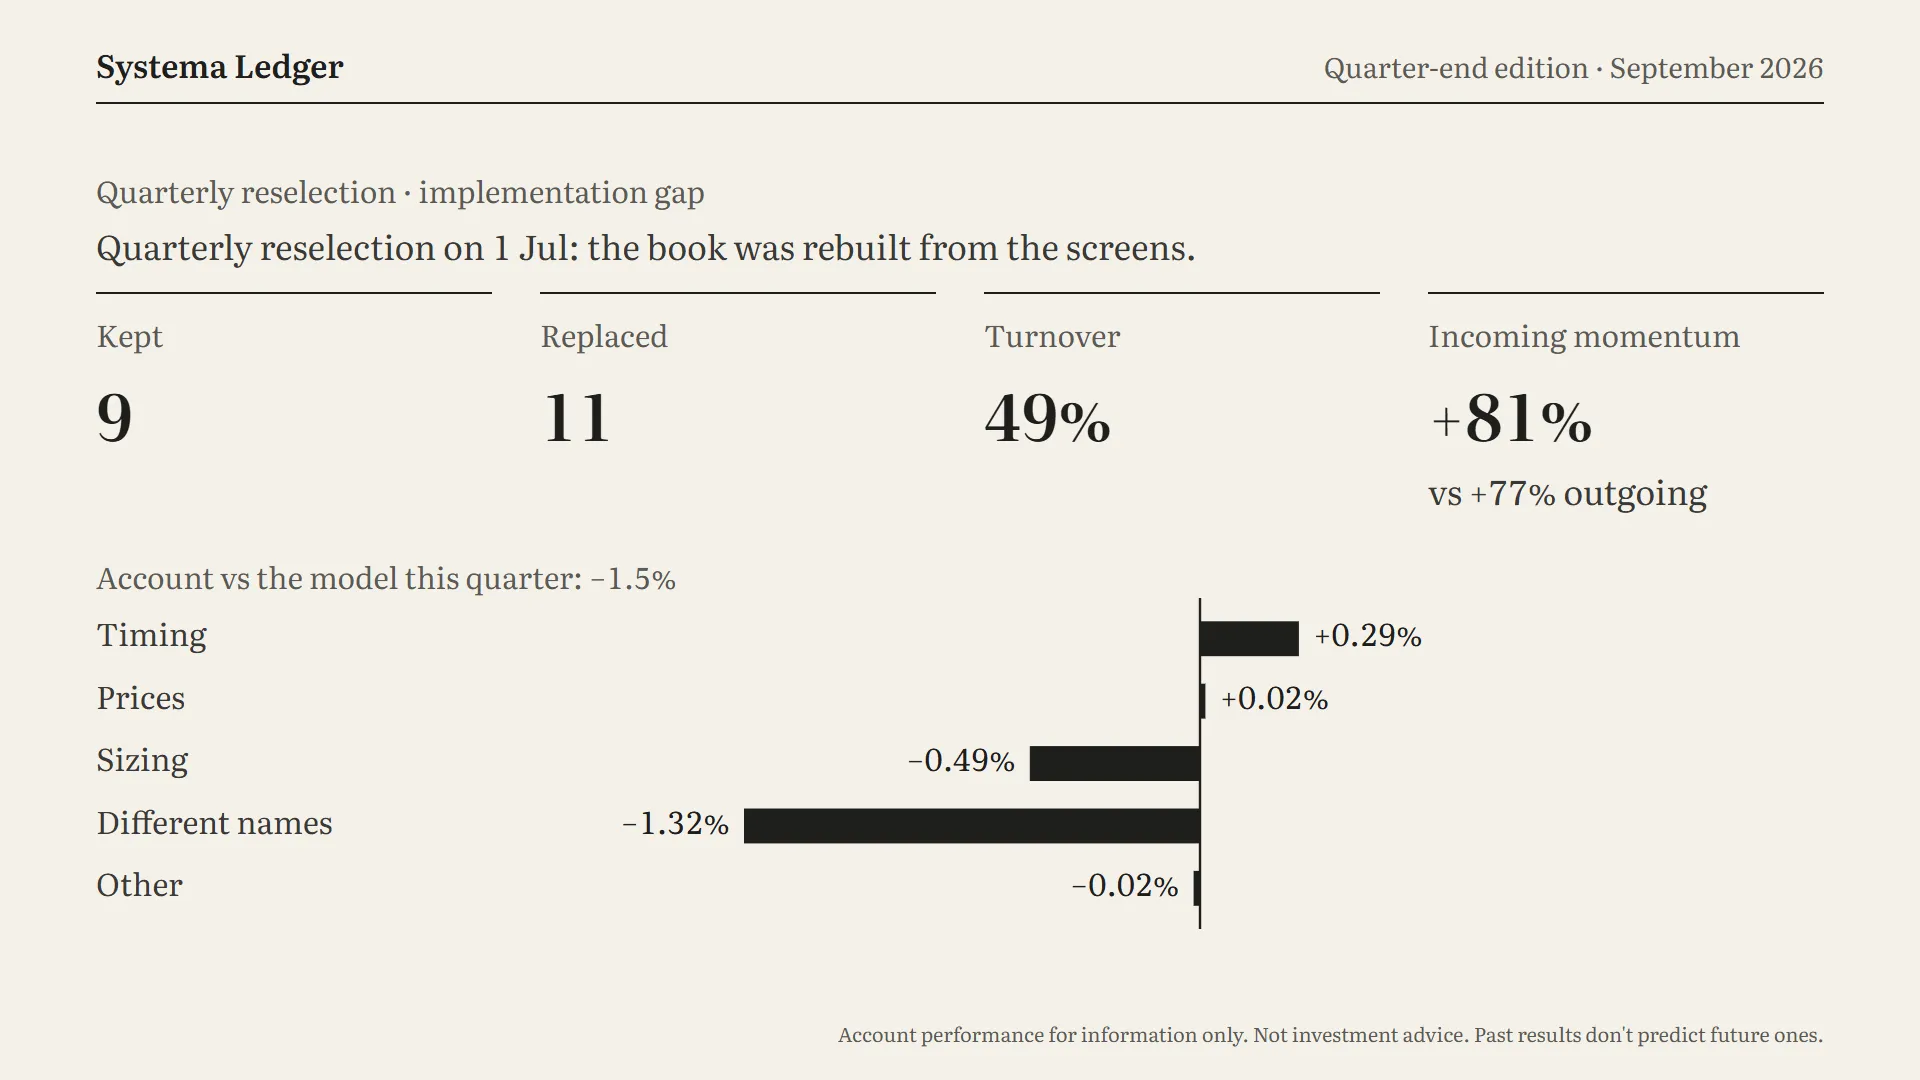
Because this is a quarter-end edition, there are three extra frames looking back over July to September.
At the start of each quarter, the system rebuilds the stock list from scratch. This quarter’s rebuild was on 1 July: 9 stocks were kept and 11 replaced, so about half the book changed. The new stocks had risen about 81% over the past year, against 77% for the ones they replaced.
The lower half answers a fair question: does my real account actually follow the model? This quarter, the account trailed the model by 1.5%. The bars show why.
Almost all of it, 1.3%, is “different names”: the real book held a few stocks the model didn’t, and the other way round. That’s because I started the real book on 13 July, and a few of its stocks differed from the model’s 1 July list. Holding slightly different amounts cost another 0.5%.
Trading itself went fine. Trading on different days than the model added 0.3%, and my trade prices were very close to the model’s.
Quarter attribution
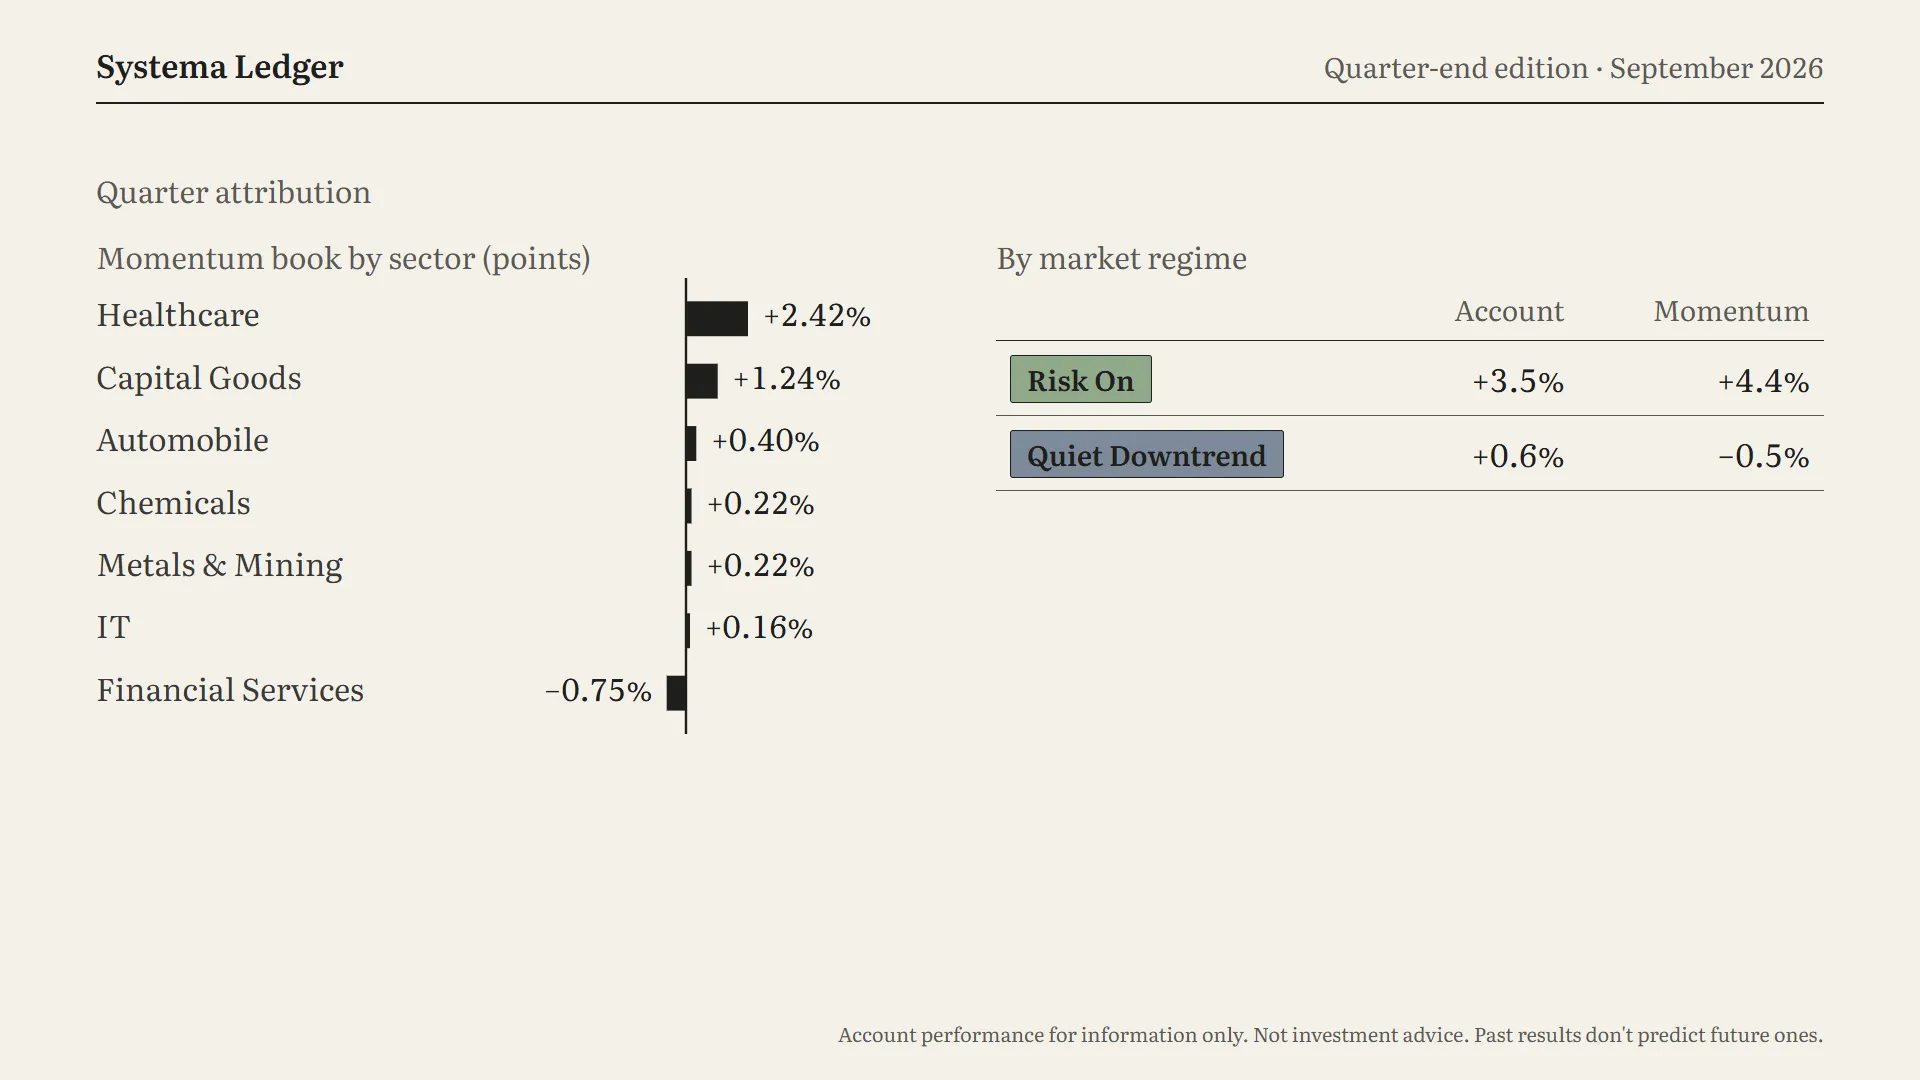
Which sectors drove the stock book this quarter? Healthcare led, adding 2.4 points, then capital goods with 1.2. Financial services was the main drag, costing 0.75.
On the right, the quarter split by the market’s mood each week. In Risk On weeks, the account made 3.5% and the stock book 4.4%. In quiet downtrend weeks, the account still made 0.6%, while the stock book slipped 0.5%.
That’s what you’d expect: momentum makes its money when the market’s trend is up, and the rest of the account helps steady things when it isn’t.
Trade statistics
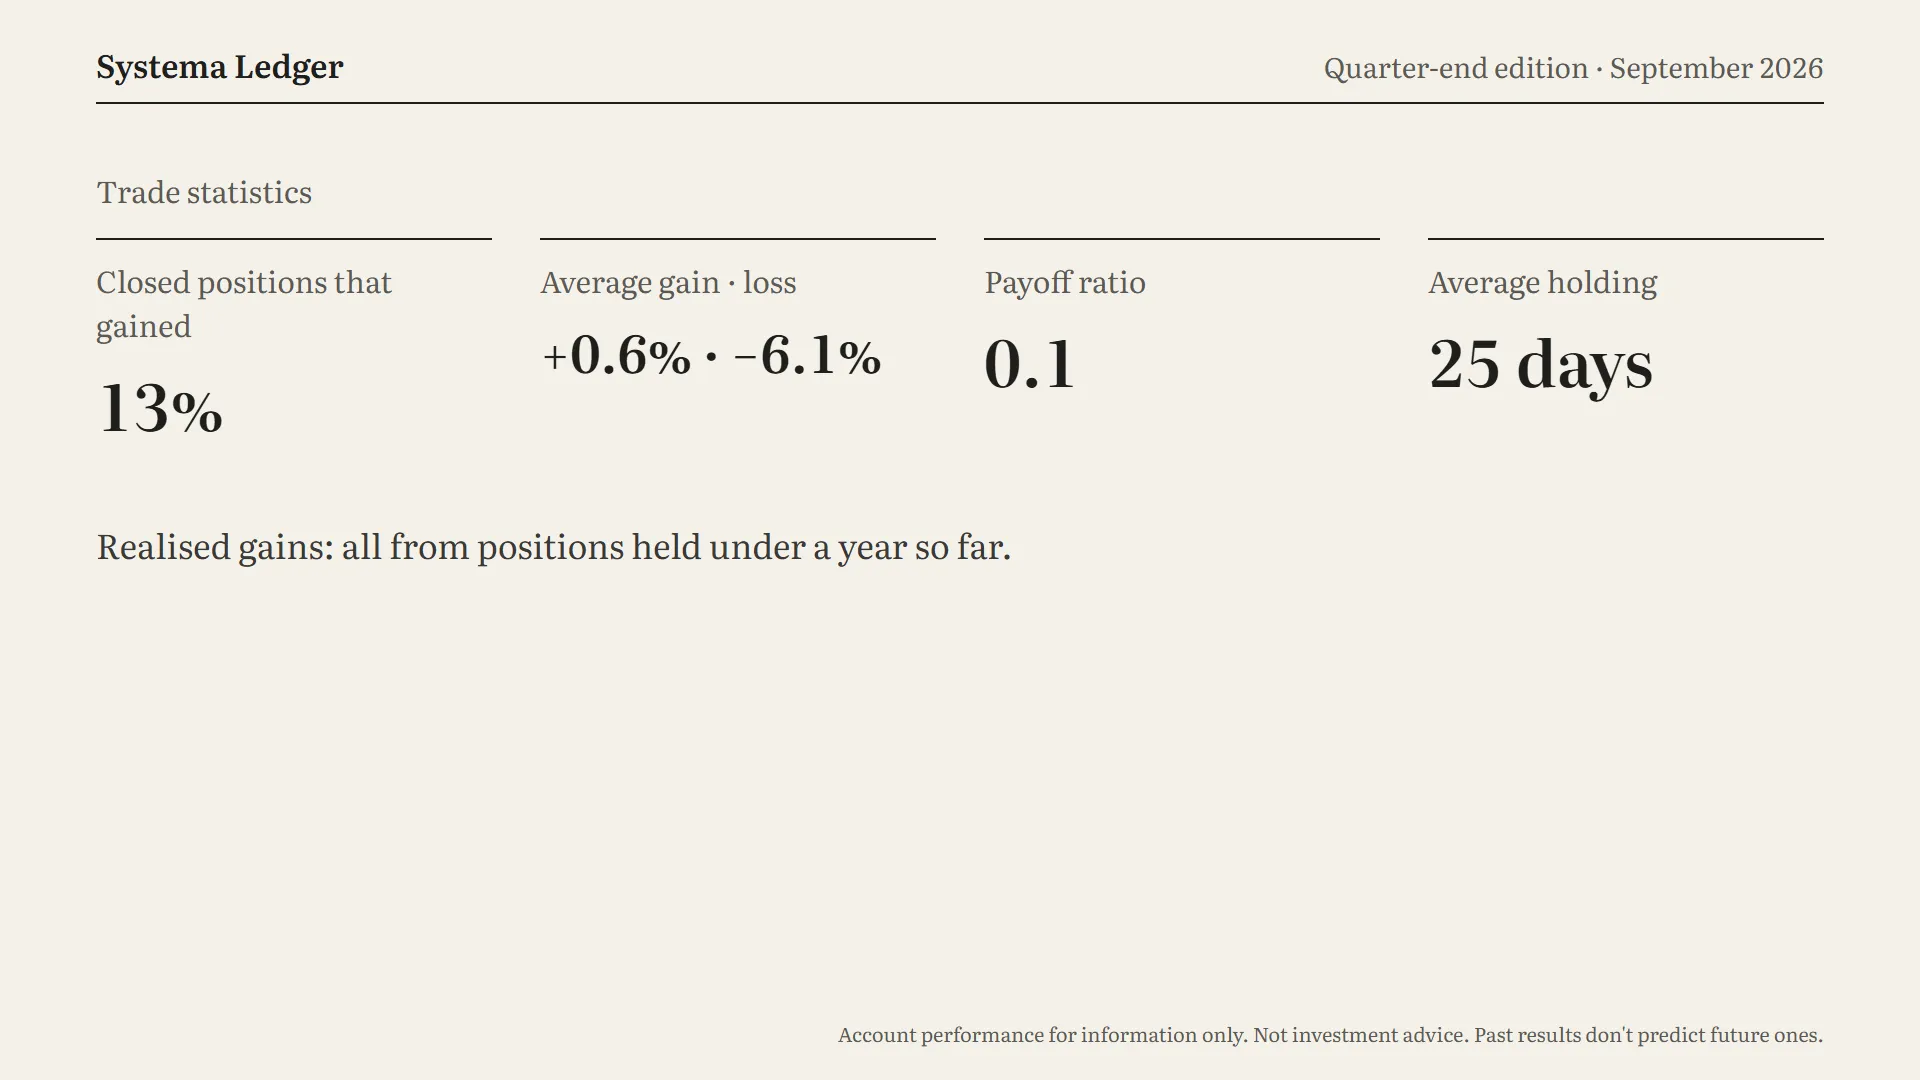
Last, the positions in the stock book that I’ve closed since going live.
Only 13% of them were gains. The average gain was 0.6%, the average loss 6.1%, and positions were held for about 25 days on average.
Those numbers look harsh, so here’s the context. The monthly tilt sells the weakest positions on purpose. That means the positions I close are mostly the losers, while the winners stay in the book and are still open. These statistics will mean more once full positions start rotating out at the quarterly rebuilds.
All realised gains so far came from positions held under a year.
Summary
So, to sum up September. It was a weak month for the market, and the account fell 4.2% against the market’s 5.9%. The momentum stocks fell with the market, and the hedge and options income cushioned part of that fall.
Since the start, the account is up 6.6% while the market is down 2.8%.
Next month’s report will cover October, including the quarterly rebuild on 1 October.
Thanks for reading. Once again, this is my own account’s performance, shared for information only. It’s not investment advice, and past results don’t predict future ones.

Referral link. *T&Cs apply. Investment in securities market are subject to market risks, read all the related documents carefully before investing. For a detailed disclaimer visit https://zerodha.com/pricing. Member ID NSE (13906), BSE (6498), MCX (46025). Brokerage will not exceed the SEBI prescribed limit.
Get new lessons by email
One email when a new article is published, free. Unsubscribe any time. We only use your email to send the newsletter; see the privacy policy.